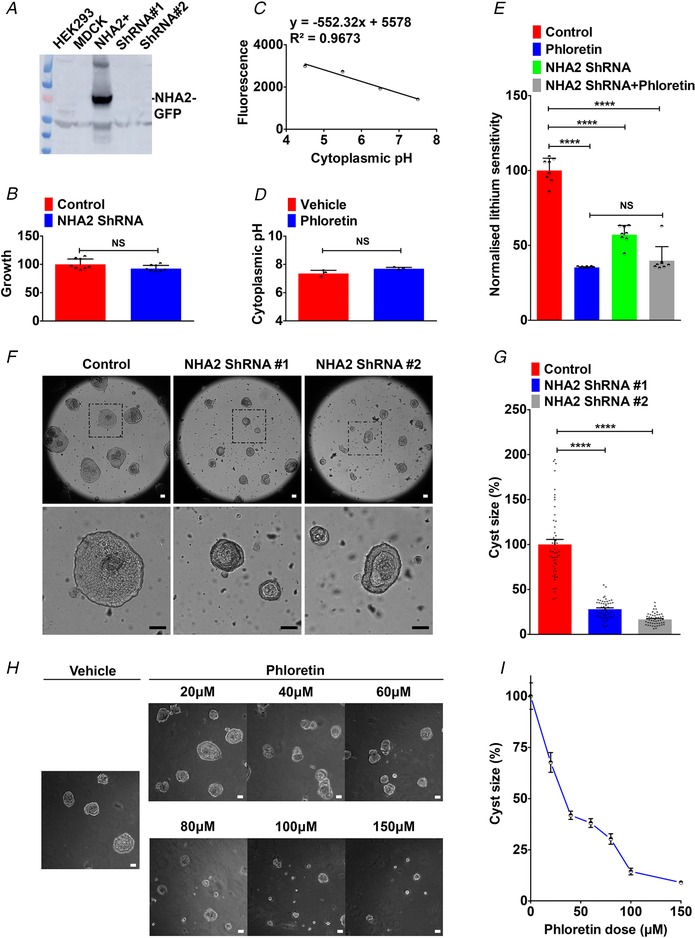
Figure 8. Knockdown or inhibition of NHA2 attenuates cyst development in vitro .

A, lentivirally mediated knockdown of NHA2 in NHA2+ MDCK cells, using two different lentiviral shRNA constructs (ShRNA 1 and ShRNA 2) targeting human NHA2, resulted in robust knockdown of GFP‐tagged NHA2. Western blot of total protein was probed using anti‐NHA2 antibody. B, lentivirally mediated knockdown of NHA2 does not alter growth of MDCK cells. Cell growth activity was measured by an MTT assay, normalized to the scrambled control (n = 8; Student's t test, NS P > 0.05). C and D, cytoplasmic pH in NHA2+ cells with vehicle or phloretin treatment was determined, as described under Methods. Calibration curve is shown in C. Inhibition of NHA2 with phloretin did not significantly alter cytoplasmic pH (D) (n = 3; Student's t test, NS P > 0.05). E, lithium sensitivity assay to validate the effect of phloretin. Cell survival in the presence of 100 mm LiCl was measured using MTT. Phloretin treatment and lentiviral NHA2 knockdown conferred significant growth sensitivity to lithium (n = 8; Student's t test, **** P < 0.0001). Note no difference in lithium sensitivity between phloretin treatment with or without NHA2 knockdown (n = 8; Student's t test, NS P > 0.05). F, lentivirally mediated knockdown of NHA2 shown in A resulted in formation of significantly smaller cysts, relative to control. Representative images are shown, and bottom row is higher magnification of boxed region from top row. G, cyst size is significantly reduced following NHA2 depletion relative to control on day 10 of culture (Control: 100.0 ± 5.6; n = 50, NHA2 ShRNA 1: 28.0 ± 1.46; n = 50, NHA2 ShRNA 2: 16.7 ± 0.91; n = 50, Student's t test, **** P < 0.0001). H, phloretin (20–150 μm) causes a dose‐dependent reduction in cyst size. Representative images are shown, with the vehicle treatment on the left. I, quantification of cyst size on day 10 of culture (n = 50/each condition). Scale bar: 25 μm. Error bars are S.E.
