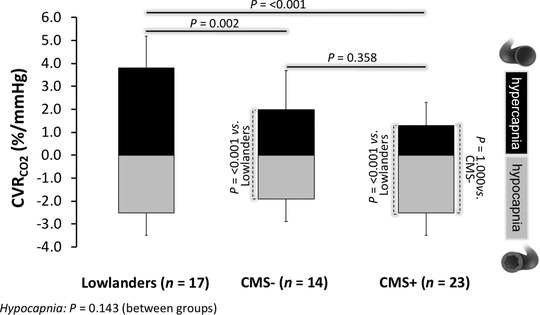
Figure 4. Cerebrovascular reactivity to carbon dioxide (CVRCO2).

Values are mean ± SD; CMS−/CMS+, highlanders without/with chronic mountain sickness; *different vs. lowlanders for respective challenge (P < 0.05). Individual hypocapnia and hypercapnia datasets were analysed using one‐way ANOVAs and post hoc Bonferonni‐adjusted independent samples t‐tests.
