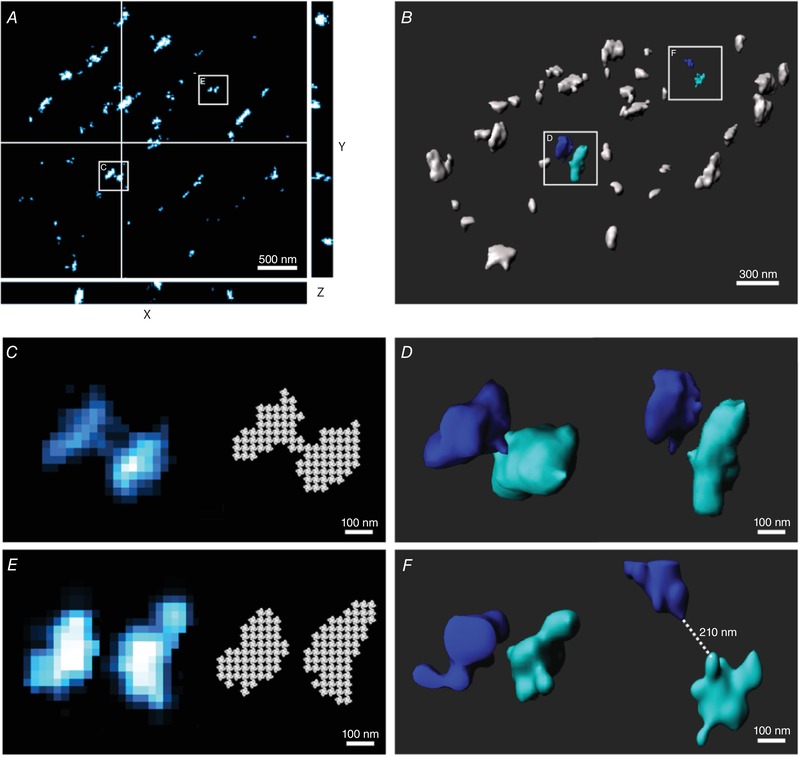
Figure 1. 3D dSTORM imaging of RyRs at the surface of isolated rat cardiomyocytes.

Orthogonal (A) and 3D (B) views of RyRs at the cell surface illustrating their undulating, non‐horizontal organization, with variable localization in the axial plane. Zoomed images of the indicated regions are provided in the lower panels, in both 2D (C and E) and 3D (D and F). 2D imaging resulted in erroneous merging of vertically aligned RyR clusters and inaccurate quantification using grid‐based methods for RyR counting (C). However, 3D imaging showed such clusters to be distinct (D). Clusters which were not axially overlapping were nevertheless observed to have underestimated inter‐cluster spacing in 2D relative to 3D imaging (E and F, respectively).
