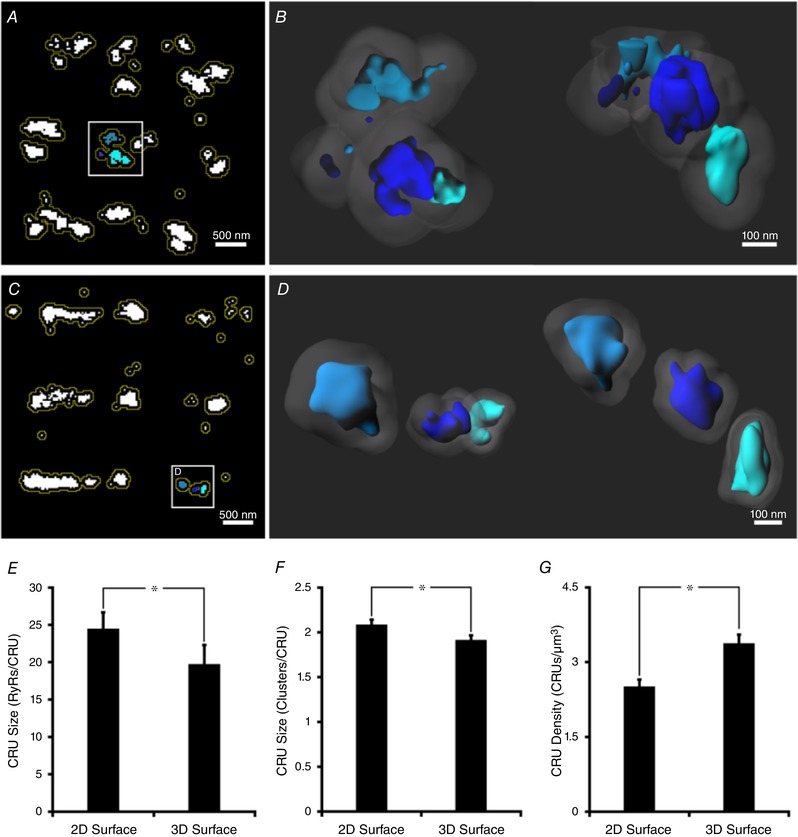
Figure 3. Quantitative comparison of cell surface Ca2+ release units in 2D and 3D.

A, in 2D images, Ca2+ release units (CRUs) were defined by grouping RyR clusters with lateral edge‐to‐edge distances within 100 nm. This was accomplished by dilating clusters by 50 nm (yellow lines), and collecting those which fused. B, for 3D images, CRU inclusion criteria also incorporated the axial plane, as shown schematically for the indicated CRU in A, with both top‐down and side‐on views (left and right panels, respectively; 50 nm cluster dilatations shown shaded). C, 2D imaging resulted in erroneous grouping of clusters into CRUs. An example grouping of 3 RyR clusters shown in the inset was observed to constitute 3 distinct CRUs when imaged in 3D (D, top‐down and side views), as inter‐cluster distances were >100 nm. With improved accuracy of CRU definition, 3D imaging revealed smaller mean CRU sizes, with fewer contained RyRs (E) and clusters (F) than estimated by 2D approaches, and higher average CRU density (G). n cells = 15, n hearts = 4; * P < 0.05 vs. 2D measurements.
