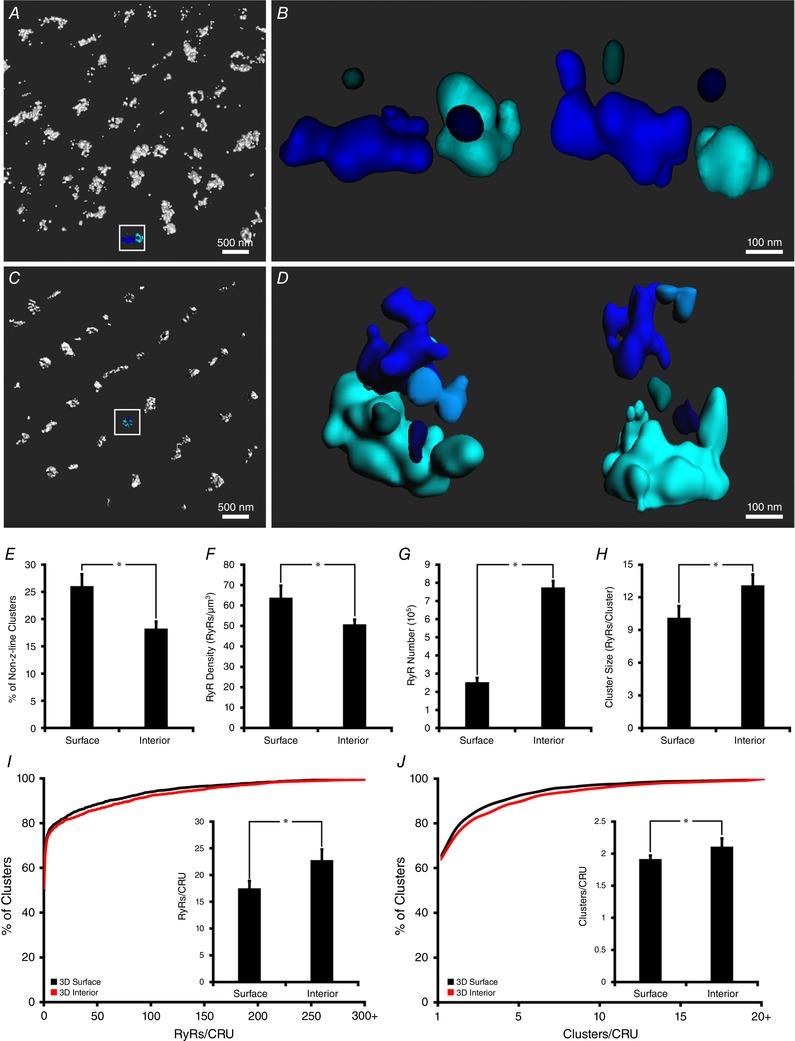
Figure 4. Comparison of 3D RyR organization at the cell surface and interior.

Representative 3D renderings of RyR clusters at the cell surface and interior are illustrated in A and C, respectively. Greater detail of example CRUs from the indicated regions are shown in B and D, with top down (left) and side‐on (right) views. In comparison with RyRs localized at the cell surface, internal sites exhibited fewer clusters localized between z‐lines (E), and lower overall RyR density (F). However, since internal sites occupy a greater fraction of the cell volume, the majority (∼75%) of the cell's ∼1,000,000 RyRs were localized within the cell interior (G). Tighter packing of RyRs along z‐lines at internal sites was associated with larger cluster sizes (H), and larger CRUs, as defined by the number of contained RyRs (I, cumulative percentage histogram with mean values in inset) and clusters (J). n cells = 15, n hearts = 4 for both surface and internal images. * P < 0.05 vs. surface measurements. [Corrections added on 14 December 2018, after first online publication: A represents the cell surface and C represents the interior]
