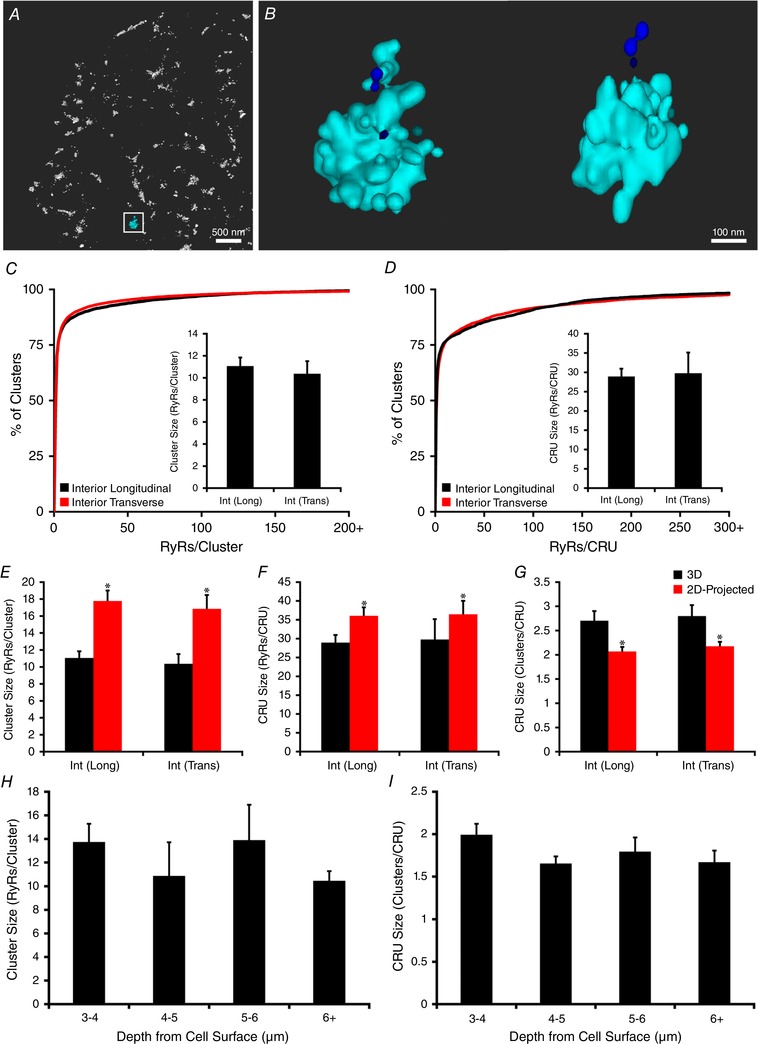
Figure 5. Comparison of 3D interior RyR cluster characteristics in longitudinally and transversely oriented cardiomyocytes.

Cardiomyocytes were embedded and arranged perpendicularly to allow transverse sectioning, imaging and quantification of RyR organization. A representative 3D rendering of a transversely oriented cell is shown in (A), with greater detail of the indicated CRU presented in two orientations (B). In comparison with imaging of cells in the longitudinal orientation (Fig. 4), transversely sectioned cells revealed very similar 3D measurements of internal RyR cluster and CRU sizes (C and D). Projection of these images to 2D resulted in overestimation of both cluster and CRU sizes, regardless of cell orientation (E and F), and underestimation of the number of clusters/CRU (G). n cells = 9 longitudinal, 15 transverse from 2 hearts. * P < 0.05 vs. 3D measurements. In longitudinally oriented cells, 3D size estimates of RyR clusters (H) and CRUs (I) were unchanged as the depth of the imaging plane was altered, suggesting rather uniform RyR organization throughout the cell interior. n cells = 15, n hearts = 4.
