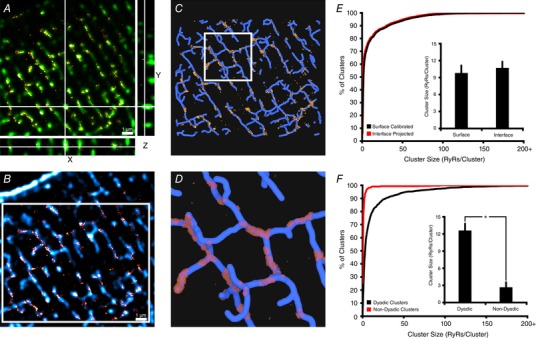
Figure 6. Correlative 3D dSTORM and confocal imaging of RyRs and t‐tubules enables visualization of dyads.

A, RyR images obtained by 3D dSTORM (red) and confocal microscopy (green) were employed to align 3D representations obtained by the two modalities. B, a single slice from an aligned 3D stack of RyRs (red, dSTORM) and t‐tubules (blue, confocal Caveolin‐3 + NCX labelling). These data were rendered as a correlative model (see main text), with RyRs packed into the interface of the two signals, assuming a 10 nm dyadic cleft. C and D, for the boxed region in B, a top‐down view of the 3D reconstruction is illustrated in C, with greater zoom shown in D. RyR positions are represented in yellow, and idealized junctional SR morphology is shown in red. Considerable variability in 3D dyadic configuration is evident, as is a general sparsity of non‐dyadic RyR clusters (15% of all clusters). E, the validity of the geometric (interface) model for estimating RyR counts within dyads was assessed by comparing with values based on event‐based calibration (Fig. 2 B). As illustrated by cumulative percentage histograms and mean measurements (inset), the two methods provided very similar estimates of RyR cluster size (n cells = 4, * P < 0.05). F, quantification of non‐dyadic clusters (>250 nm distant from t‐tubules) revealed that these clusters are significantly smaller than their dyadic counterparts, and contain a disproportionate fraction of single ‘rogue’ RyRs. [Correction made on 14 December 2018, after first online publication: Figure 6 was replaced.]
