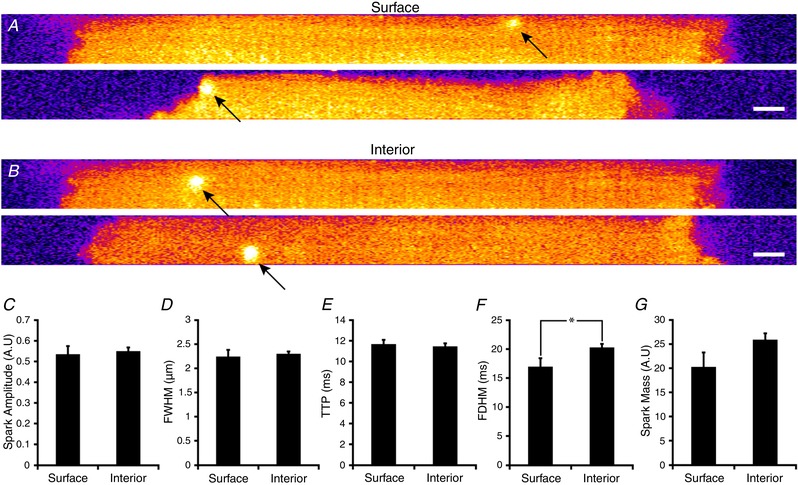
Figure 7. Comparison of Ca2+ sparks at the cell surface and interior.

Rapid time‐series imaging of Ca2+ sparks was performed using confocal frames positioned to include both the cardiomyocyte surface and the interior. Representative single frames showing events at these two locations are presented in A and B, respectively. (Scale bar = 5 μm). Similar amplitude (C), full‐width half‐maximum (D), and time to peak (E) values were measured for Ca2+ sparks originating at the surface and interior. However, spark duration (F) was significantly longer for internal sparks, and overall spark mass (G) tended to be larger. Surface: n sparks = 26; interior: n sparks = 111; n cells = 21, n hearts = 3. * P < 0.05 vs. surface measurements.
