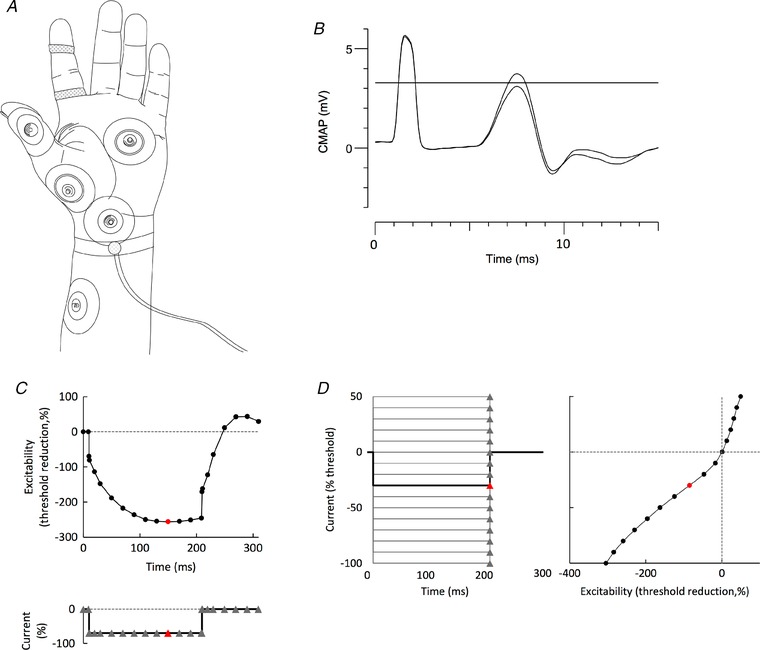
Figure 1. Methodology.

A, recording arrangement. Stimuli were delivered at the wrist (cathode) using Ag/AgCl electrodes with the anode 10 cm distal on the radial edge of the forearm. CMAPs were recorded over the thenar eminence, with the reference electrode on the proximal phalanx of the thumb. CSAPs were recorded using disposable Ag/AgCl ring electrodes on digit 2. The same ground (in the palm) was used for both motor and sensory recordings. A thermistor was strapped around the wrist to record skin temperature close to the site of stimulation (Howells et al. 2013). B, principle of threshold tracking. A target threshold was set, as indicated by the horizontal line, here ∼3 mV, which is ∼40% of the size of the maximal CMAP (or CSAP). If the target response exceeded that threshold (e.g. as demonstrated by the larger CMAP), the intensity of the next test stimulus was reduced. If the target response was less than the threshold value (as in the smaller CMAP), the intensity of the next test stimulus was increased. C and D, application of the technique to the recording of TE to a –70% hyperpolarizing current (C) and to the I–V relationship (D). C, threshold was measured at the intervals indicated by triangular markers, before, during and after a square wave hyperpolarizing current lasting 200 ms, set to –70% of the control threshold. D, threshold was measured 200 ms after the onset of 15 square‐wave polarizing currents from +50% (depolarizing, top left) to –100% (hyperpolarizing, bottom). The change in excitability in the right panel is equivalent to a conventional I–V relationship. In (C) and (D), the measurements on the threshold plots in red are indicated on the current plots in red.
