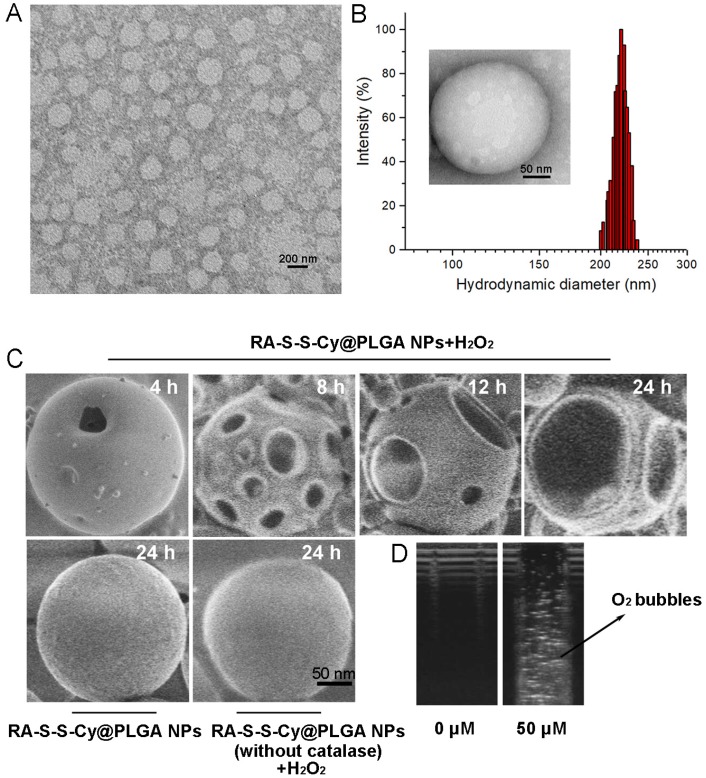
Figure 1.
(A) TEM micrographs of RA-S-S-Cy@PLGA NPs. Scale bar: 200 nm. (B) Size distribution of RA-S-S-Cy@PLGA NPs characterized by DLS at 25 °C. Insets: TEM micrograph of RA-S-S-Cy NP. Scale bars: 50 nm. (C) SEM micrographs of RA-S-S-Cy@PLGA NPs incubated with and without 100 µM H2O2, or RA-S-S-Cy@PLGA NPs (without catalase) incubated with 100 µM H2O2 for 24 h. Scale bars: 50 nm. (D) Ultrasound images of RA-S-S-Cy@PLGA NPs suspended in media with H2O2 at different concentrations.

