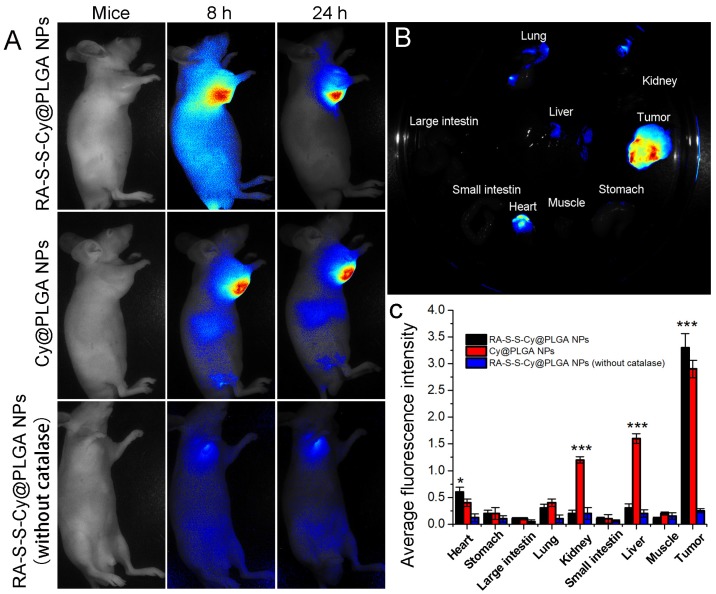
Figure 7.
(A) Time-dependent in vivo fluorescence images of subcutaneous HCT-116 tumor-bearing mice after i.v. injection of 10 mg kg-1 RA-S-S-Cy@PLGA NPs, Cy@PLGA NPs, or RA-S-S-Cy@PLGA NPs (without catalase). The fluorescence images were acquired using an IVIS Spectrum instrument equipped with 675/30 nm excitation and 720/20 nm emission filters. (B) Ex vivo fluorescence imaging of tumor and normal tissues harvested from the euthanized tumor-bearing nude mice at 24 h post injection of RA-S-S-Cy@PLGA NPs. (C) Ex vivo fluorescence intensity of the major organs and tumor tissues of nude mice 24 h after receiving RA-S-S-Cy@PLGA NPs, Cy@PLGA NPs, or RA-S-S-Cy@PLGA NPs (without catalase) via tail vein injection. Data are mean ± SD (n = 6). *P < 0.05, **P < 0.01, ***P < 0.001.

