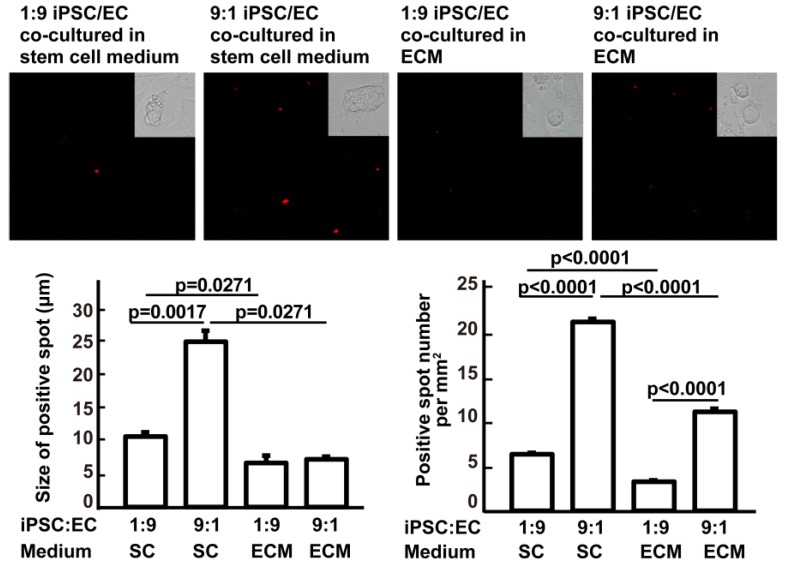
Figure 5.
Effects of culture media and iPSC/EC ratio on the formation of iPSC masses. Upper panels: red fluorophore-labeled iPSCs and their derivatives visualized under a fluorescence microscope. Insets are bright-field images of the cells. Lower left: size of the iPSC masses. Lower right: number of red fluorescent spots per mm2. Data are represented as mean ± SEM.

