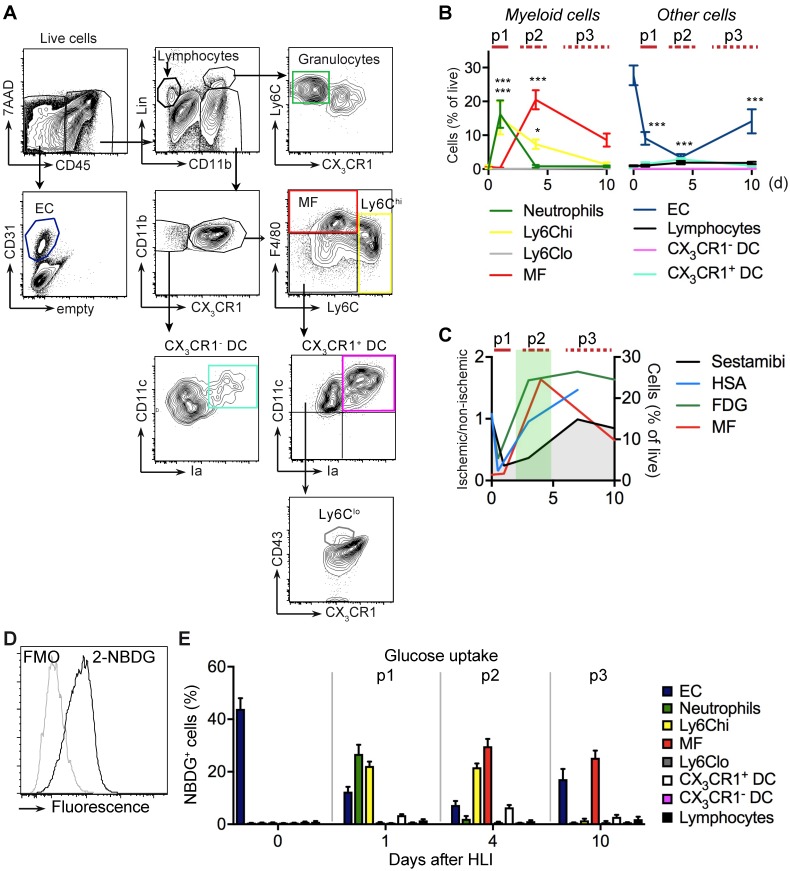
Figure 3.
Flow cytometry analysis of cell populations and glucose uptake in single cell suspension of ischemic muscle. (a) Gating strategy for flow cytometry to define various cell populations, representative HLI d4. (b) Quantification of cell populations over time. Data represent cumulative of 7 independent experiments. n=5 (d0), n=3 (d1), n=6 (d4), n=5 (d10). Statistical analysis compares each time point vs baseline. *P<0.05, **P<0.01, ***P<0.001, 1-way ANOVA with Bonferroni's multiple comparison test. (c) Schematic combination of SPECT/CT and [18F]-FDG PET/CT data with the dynamics of macrophage frequencies before and after induction of HLI. (d-e) Glucose uptake studies in single cell suspensions with 2-NBDG. (d) Representative flow cytometry of 2-NBDG fluorescence, HLI d4. (e) Cumulative relative frequencies of various cell populations in the total 2-NBDG+ cell gate, pooled from 7 independent experiments. n=5 (d0), n=6 (d1), n=7 (d4), n=4 (d10).

