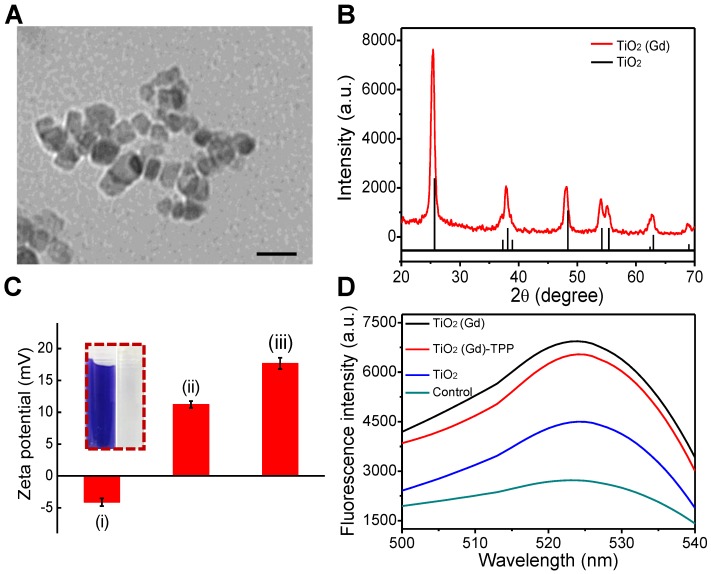
Figure 2.
Characterization and ROS generation of the nanosensitizer. (A) A TEM image of TiO2 (Gd)-TPP NPs; scale bar is 40 nm. (B) PXRD patterns of TiO2 (Gd) NPs. The vertical line represents anatase TiO2 (ICDD-PDF no. 21-1272). (C) Zeta potentials of each step modification: (i) TiO2 (Gd) NPs; (ii) TiO2 (Gd)-NH2 NPs; (iii) TiO2 (Gd)-TPP NPs; Insert: ninhydrine assay of TiO2 (Gd)-NH2-precipitation (right) and the supernatant solution (left) after centrifugation. (D) Detection of O2•- by DBZTC (λex = 490 nm, λem = 525 nm) after X-ray irradiation.

