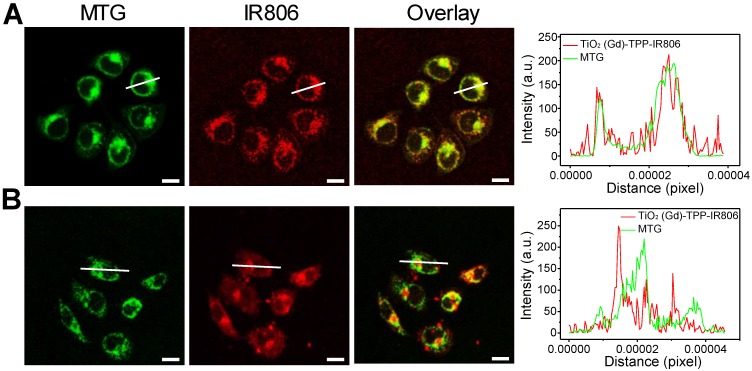
Figure 3.
Mitochondrial targeting of the nanosensitizer under confocal imaging. Mitochondrial targeting of (A) TiO2 (Gd)-TPP-IR806 and (B) TiO2 (Gd)-IR806 under confocal imaging. Images of NPs (excitation = 633 nm, emission = 750-800 nm), Mito-Tracker Green (MTG) stained mitochondria (excitation = 488 nm, emission = 500-550 nm), the overlay channel of NPs and mitochondria (right). Scale bars are 15 µm; Quantification data of line scanning profiles in the corresponding confocal images (right).

