Figure 5.
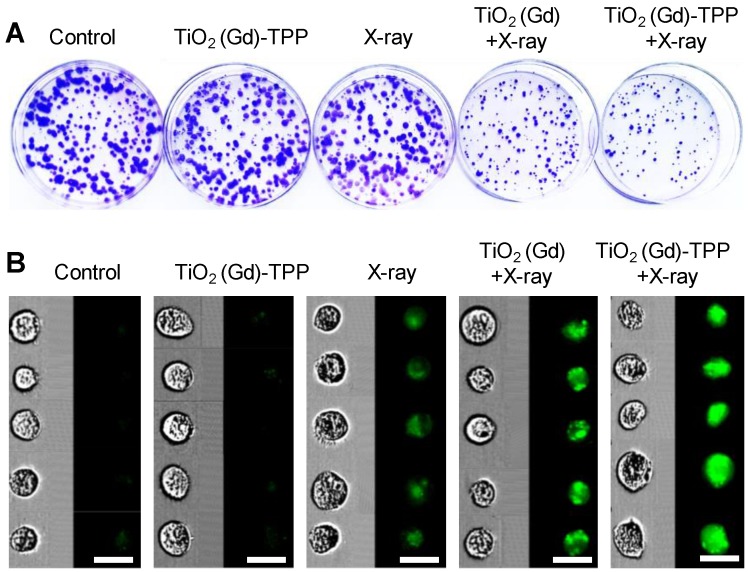
Cell proliferation by clonogenic survival assay and CFSE staining. (A) Representative photographs of colony formation. Cells were treated with different conditions and then incubated for 10 days. Subsequently, cells were fixed, stained and imaged. The diameter of the culture dish is 60-mm. (B) Flow cytometry data of the cells labeled with CFSE. Cells were treated with different conditions and then incubated for 7 days. Subsequently, cells were digested and imaged using imaging flow cytometry (scale bars are 20 μm).

