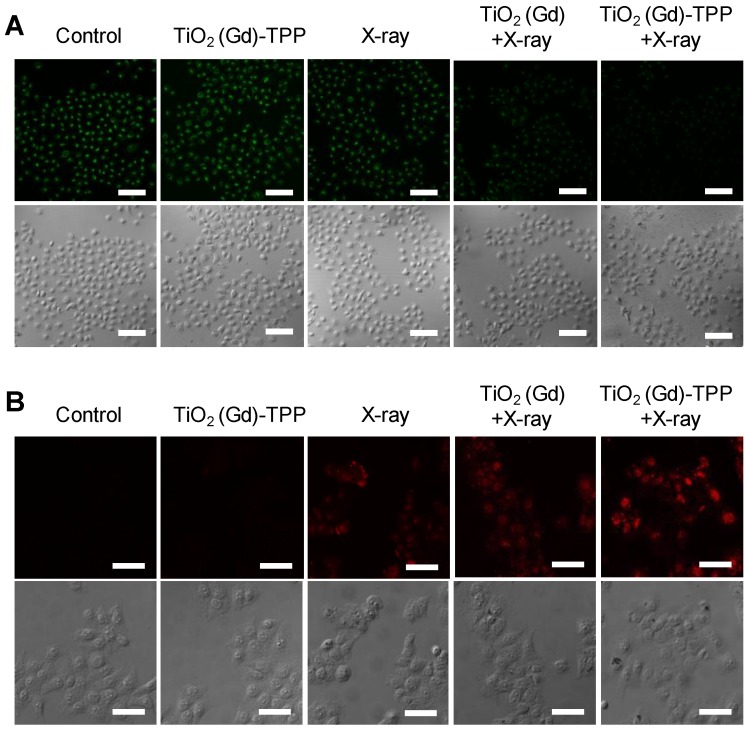
Figure 6.
Detection of ∆ψm and imaging intracellular caspase 3. (A) Confocal images of ∆ψm by CLSM after cells were stained with Rhodamine 123 (λex = 488 nm, λem = 500-550 nm). Scale bars are 125 µm. (B) Images of immunofluorescence staining of caspase 3 by CLSM. Confocal images were acquired (λex = 633 nm, λem = 640-700 nm) after cells received different treatments (scale bars are 50 µm).

