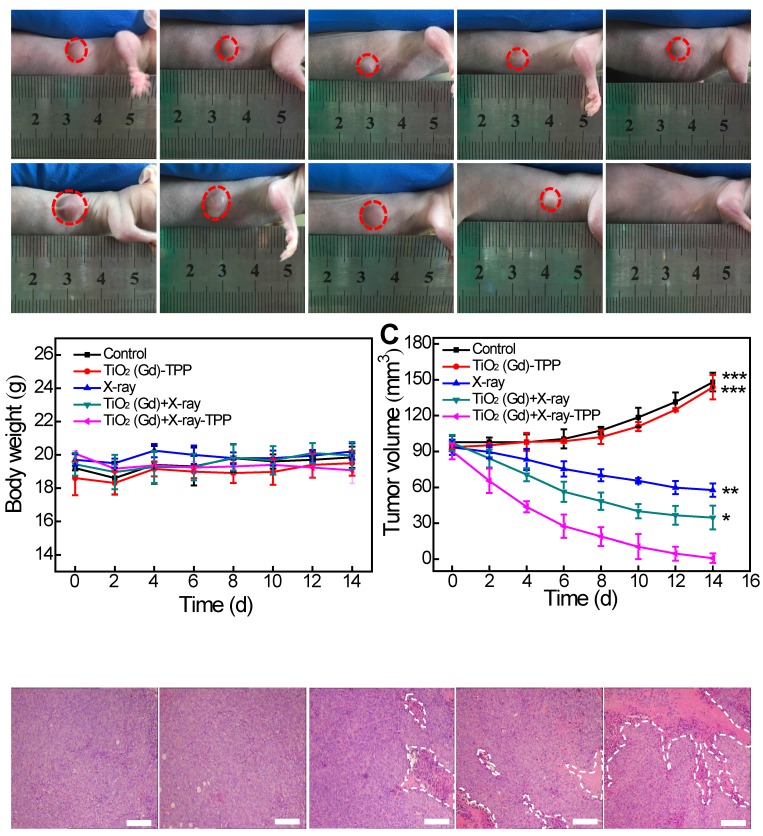
Figure 7.
In vivo anti-tumor efficacy study of the nanosensitizer in a mouse model. (A) Photographs of the mice before (Day 0) and after (Day 14) various indicated treatments. The dosage of NPs was 3 mg·kg-1, followed by X-ray irradiation (6 Gy). (B) Body weight changes of mice in various treatment groups. (C) Tumor volume changes of the treatment groups. (D) Tumor H&E staining for the treatment groups. Tumor slices were obtained after treatment for 12 h (scale bars are 200 μm). ***P < 0.001, **P < 0.01, *P < 0.05 relative to the TiO2 (Gd)-TPP+X-ray group.

