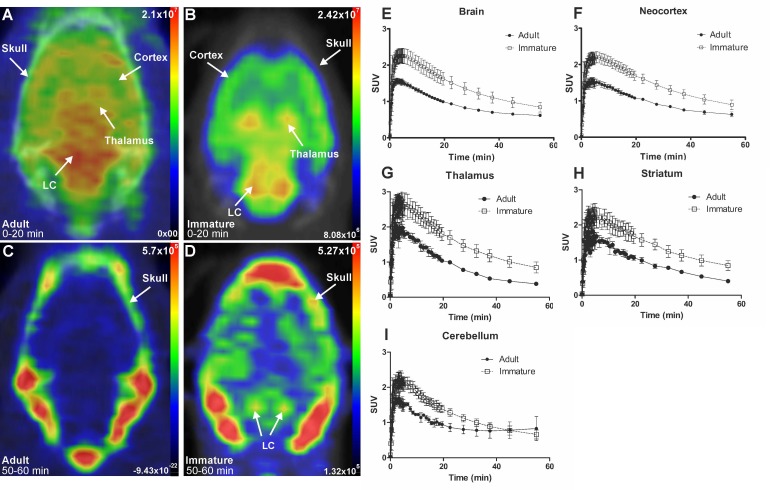
Figure 3.
Representative in vivo summed PET images of [18F]NS12137 uptake in adult (left) and immature (right) Sprague-Dawley rats 0-20 min (A-B) and 50-60 min (C-D) after injection. (E-I) Average time activity curves (TACs) of [18F]NS12137 uptake in the whole brain, neocortex, thalamus, striatum, and cerebellum in adult (n=3) and immature rats (n=6). Values in the graphs are presented as mean ± SD.

