
Figure 1. Inhibition of constitutively active TAM channels by GSK‐7975A.
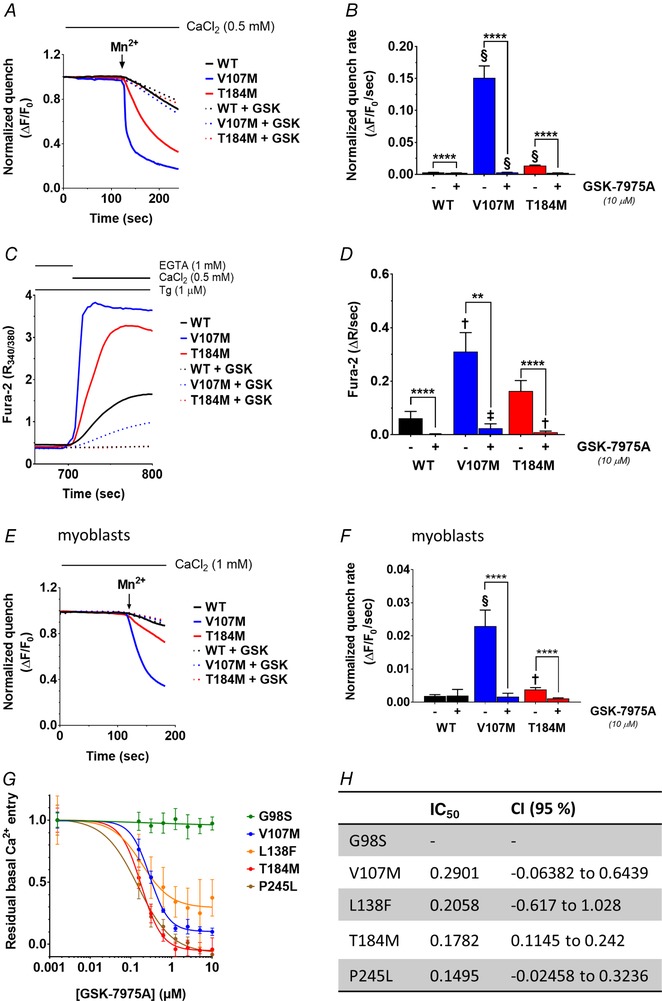
A, mean recordings of Mn2+‐induced Fura‐2 fluorescence quench in store‐replete HEK‐293T cells transiently expressing ORAI1‐WT, ‐V107M or ‐T184M, treated or not with 10 μm GSK‐7975A. Mn2+ (500 μm) was added to the Ca2+ recording solution when indicated (arrow) and the quench rate assessed at the isosbestic point of Fura‐2 (360 nm). B, statistical evaluation of the quench rates. Data are means ± 95% CI of 96–231 cells from 2 independent experiments. C, representative Fura‐2 ratio fluorescence responses evoked by readmitting Ca2+ to thapsigargin (Tg)‐treated HEK‐293T cells co‐expressing STIM1 and ORAI1‐WT, ‐V107M or ‐T184M, treated or not with 10 μm GSK‐7975A. D, statistical evaluation of the Ca2+ influx rates, assessed by measuring the slope of the response in C. Data are means ± 95% CI of 14–54 cells from 3 independent experiments. E, mean recordings of Mn2+‐induced Fura‐2 quench in store‐replete human primary myoblasts transiently expressing ORAI1‐WT, ‐V107M or ‐T184M, treated or not with 10 μm GSK‐7975A. F, statistical evaluations of the quench rates. Data are means ± 95% CI of 21–54 cells from 3 independent experiments. In B, D and F, the two‐tailed Kruskal–Wallis test with Dunn's correction was used to show statistical differences between treated and untreated groups (**** P ≤ 0.0001, ** P ≤ 0.01) or between the WT and each of the mutated ORAI1 in treated or untreated conditions (§P ≤ 0.0001, ‡P ≤ 0.001, †P ≤ 0.01). G, GSK‐7975A dose–response curves of normalized constitutive Ca2+ entry in populations of HEK‐293T cells transfected with the TAM‐associated ORAI1‐G98S, ‐V107M, ‐L138F, ‐T184M and ‐P245L. Ca2+ levels were assessed with Calcium 5 in a plate reader, as described in Methods. H, half‐inhibitory concentration (IC50) of the constitutive Ca2+ entry through the mutated ORAI1 channels shown in G. Data are means ± 95% CI of 2–3 independent plates (12–18 wells).