
Figure 2. Electrophysiological recordings of TAM‐associated ORAI1 channels.
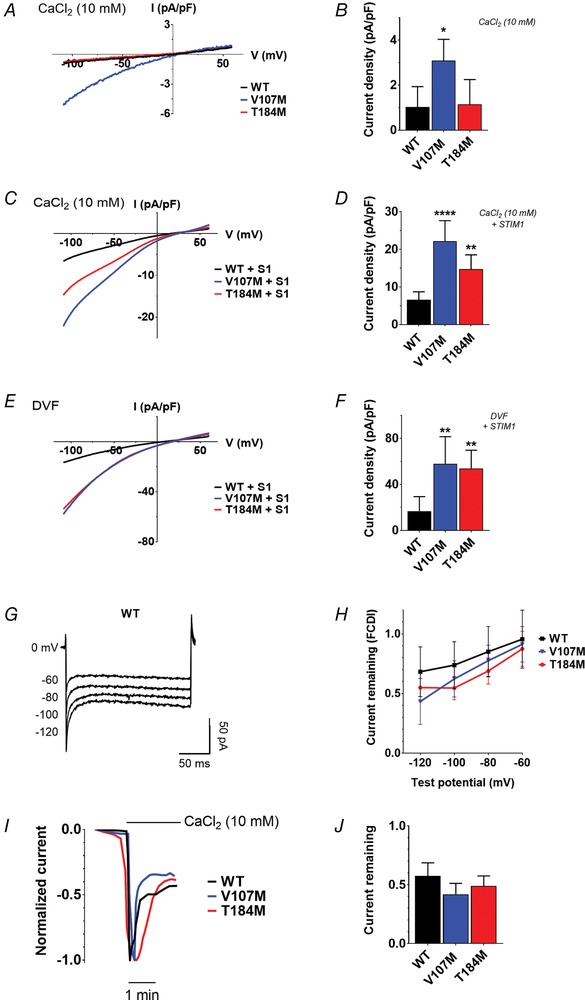
A, representative I CRAC recordings in HEK‐293T cells expressing ORAI1‐WT, ‐V107M or ‐T184M without STIM1, treated with Tg and exposed to 10 mm Ca2+. Currents were evoked by voltage ramps from −120 to 70 mV. B, statistical evaluation of current densities in A, at −110 mV. Data are means ± 95% CI of 7 cells for each condition (two‐tailed Kruskal–Wallis test). C, mean I CRAC recordings in 10 mm Ca2+ of cells co‐expressing WT or mutant ORAI channels together with STIM1 and treated with Tg. All currents are inwardly rectifying with a positive reversal potential (E rev). D, statistical evaluation of current densities at −110 mV in C. Data are means ± 95% CI of 14–16 cells (two‐tailed Kruskal–Wallis test). E, mean current recordings in divalent free (DVF) solution of cells expressing STIM1 and ORAI1 WT or mutant channels, treated with Tg. F, statistical evaluation of the current densities at −110 mV in E. Data are means ± 95% CI of 6–9 cells (two‐tailed Kruskal–Wallis test). G, illustrative recordings of I CRAC fast Ca2+‐dependent inactivation (FCDI) in HEK‐293T cells co‐expressing STIM1 and ORAI1‐WT during voltage pulses of −120, −100, −80 and −60 mV in 10 mm Ca2+. The pipette solution contained 10 mm EGTA and 2 μm Tg. H, fraction of current remaining 195 ms after each hyperpolarizing voltage step (mean ± 95% CI of 7–11 cells). Two‐way ANOVA and Dunnett's comparison tests were used to compare WT and TAM‐variant channels at each voltage step. I, illustrative recordings of I CRAC slow Ca2+‐dependent inactivation in cells co‐expressing STIM1 and ORAI1‐WT, ‐V107M or ‐T184M. Cells were kept in nominal Ca2+‐free solution before acute exposure to 10 mm Ca2+. The internal solution contained 1.2 mm EGTA and 2 μm Tg. J, statistical evaluation of SCDI as the fraction of current remaining after stabilization of the current in 10 mm Ca2+ (mean ± SEM of 6–11 cells, two‐tailed Kruskal–Wallis test).