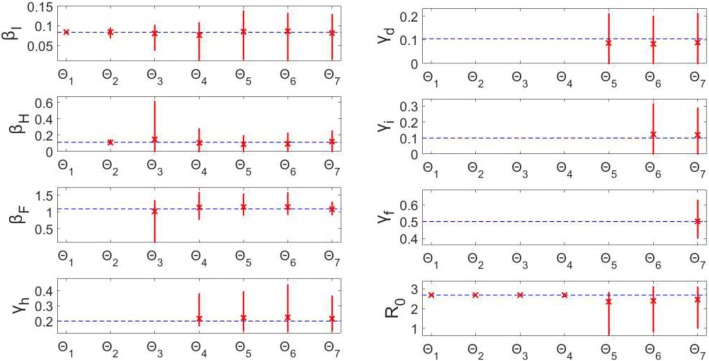
Fig. 9.
Model 3–95% confidence intervals (vertical red lines) for the parameter estimate distributions obtained from the 200 realizations of the simulated datasets. Mean estimated parameter value is denoted by red x, and the true parameter value is represented by the blue horizontal line. Θi denotes the estimated parameter set, where i indicates the number of parameters being jointly estimated

