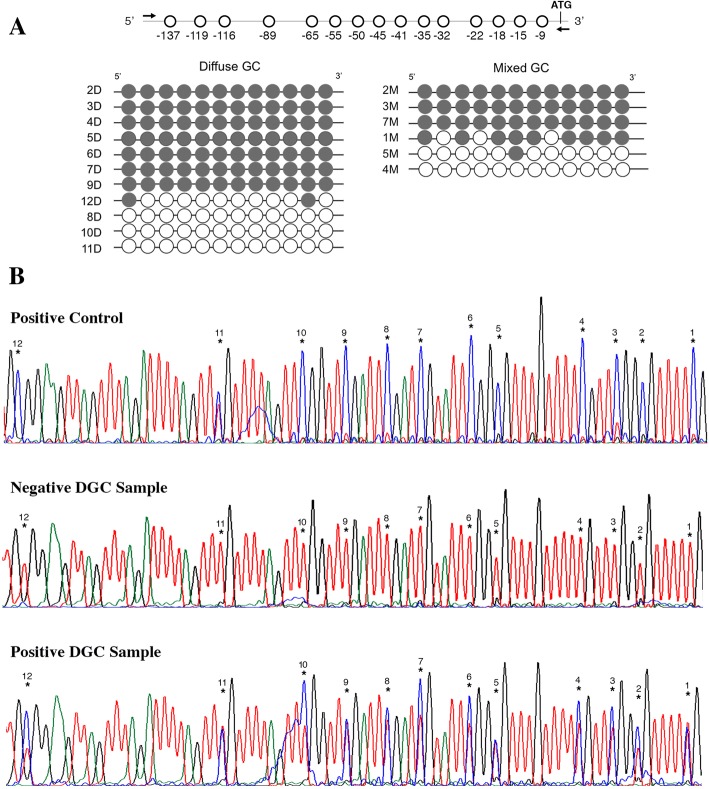
Fig. 4.
Methylation analysis results. a) Representation of the promoter region analyzed for methylation. Filled circles represent the methylated CpG sites and clear circles symbolize non-methylated sites. Each line represents one individual (ID shown). b) Sequencing results for the methylation analysis. The CpG sites are numbered

