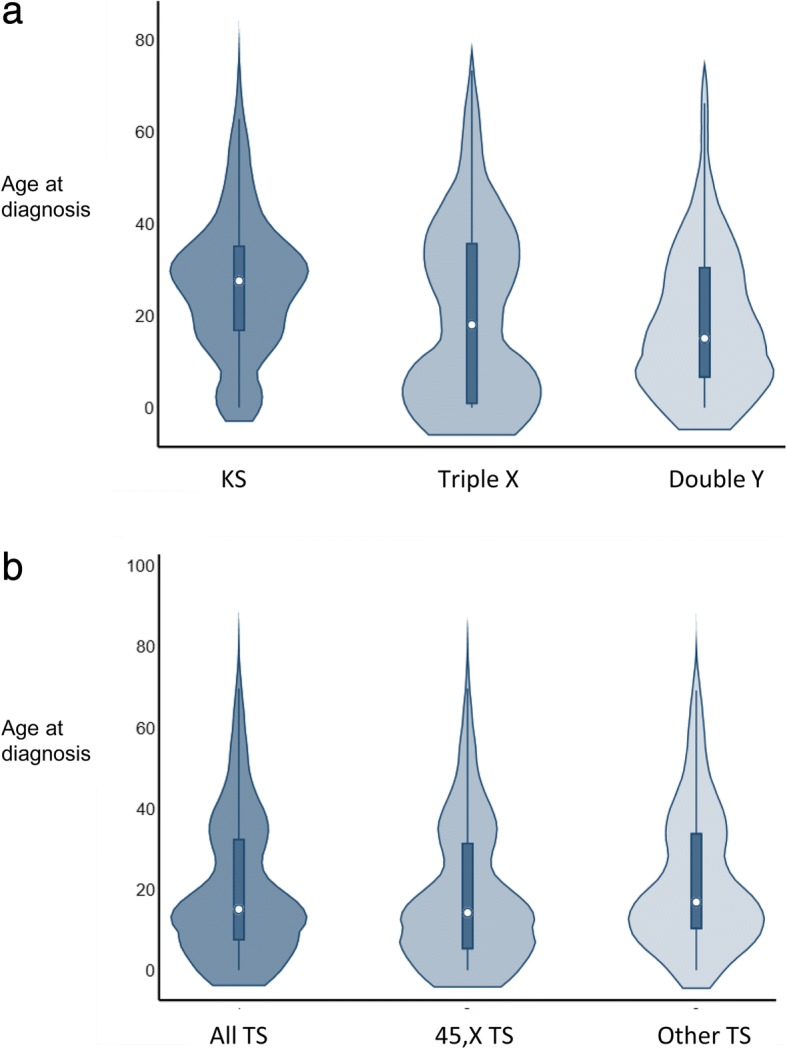
Fig. 5.

Age at diagnosis among sex chromosome abnormalities. Violin plots of age at diagnosis among a Klinefelter syndrome (KS), Triple X syndrome (Triple X) and Double Y syndrome (Double Y) and among b all Turner syndrome (TS), TS with a 45,X karyotype and TS with other karyotypes, diagnosed during 1970–2014. The small circle in the middle of the plot is median age, the dark rectangle depicts interquartile range, the thin dark lines depicts 95% confidence interval, and the density plot width equals frequency of age at diagnosis
