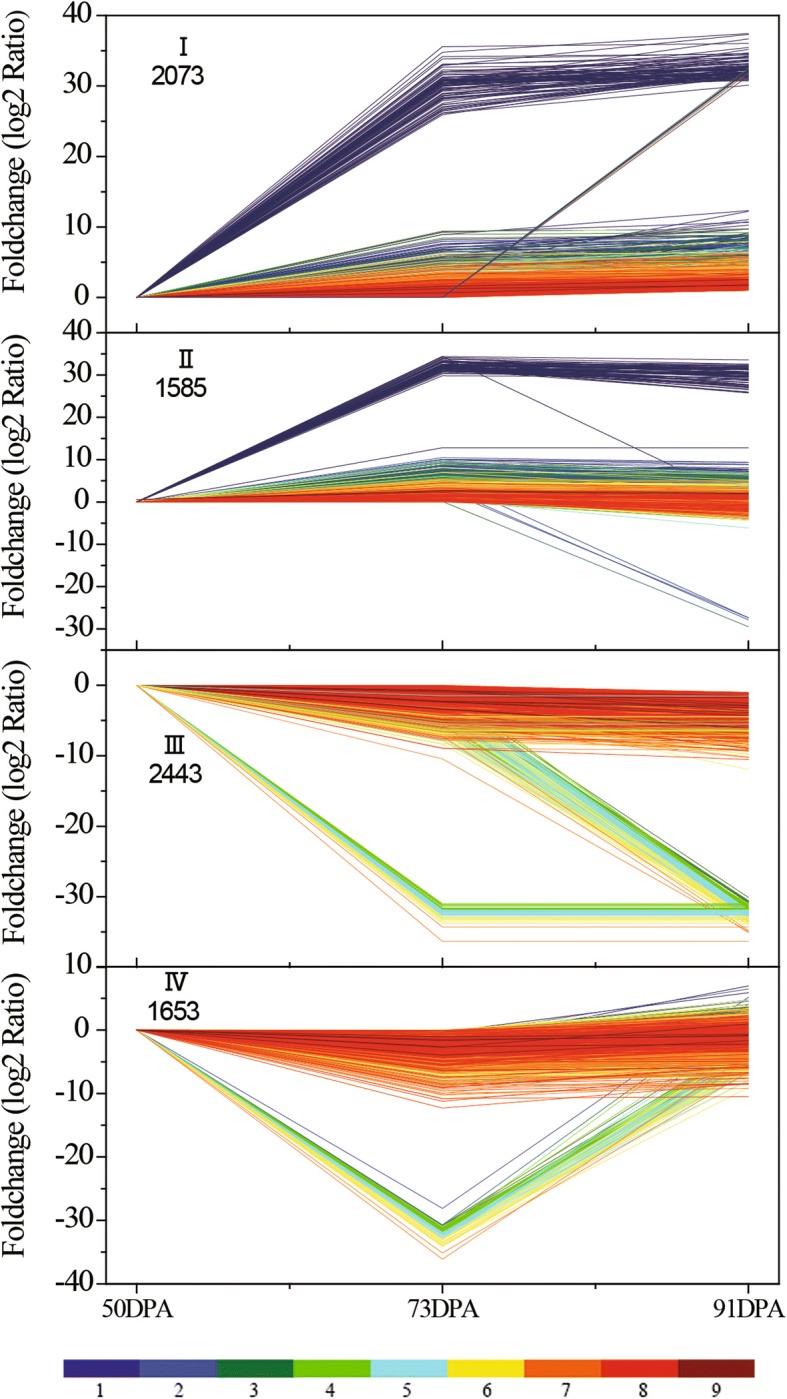
Fig. 3.

Unigene expression profiles during apricot fruit ripening. Four expression profiles are shown, with I and III indicating unigenes with up-regulated and down-regulated expression, respectively, and II and IV indicating those with up- and then down-regulated, and down- and then up-regulated expression, respectively. The 9 different colored lines show the absolute expression level at 50 DPA, with the FPKM values 0–0.1, 0.1–0.7, 0.7–2, 2–4, 4–8, 8–20, 20–100, 100–1000, 1000–12,500 represented by colors 1 to 9, respectively
