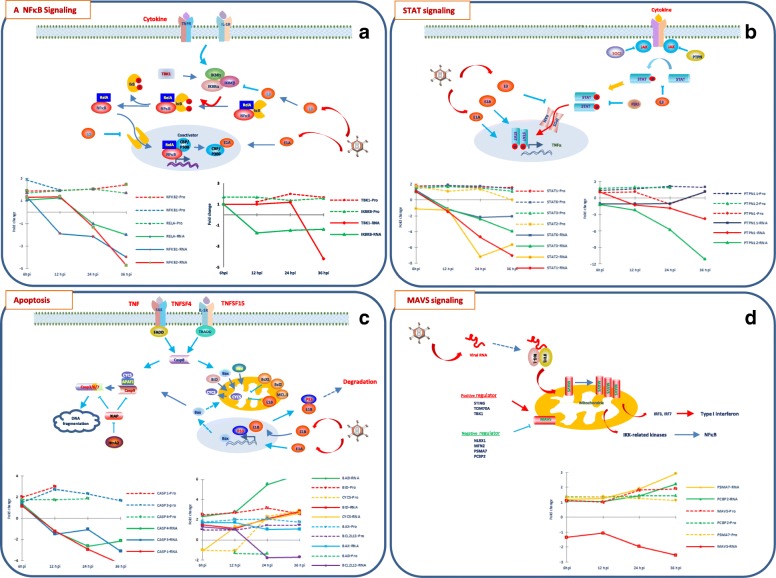
Fig. 2.
Schematic representation of the expression profiles of key components of NFκB (a), STAT (b), apoptosis (c) and MAVS (d) pathways. The involvement of Ad2 proteins is also indicated. Graphs display the expression profiles (fold change between Ad2 and mock) of genes that detected at both protein (dash line) and RNA (solid line) levels at 4 time points. The same color is used for the corresponding protein and RNA. Most of these proteins were up-regulated at 6 hpi and sustained until late phase, while their RNA level increased at 6 hpi and then decreased at 12 or 24 hpi until late phase

