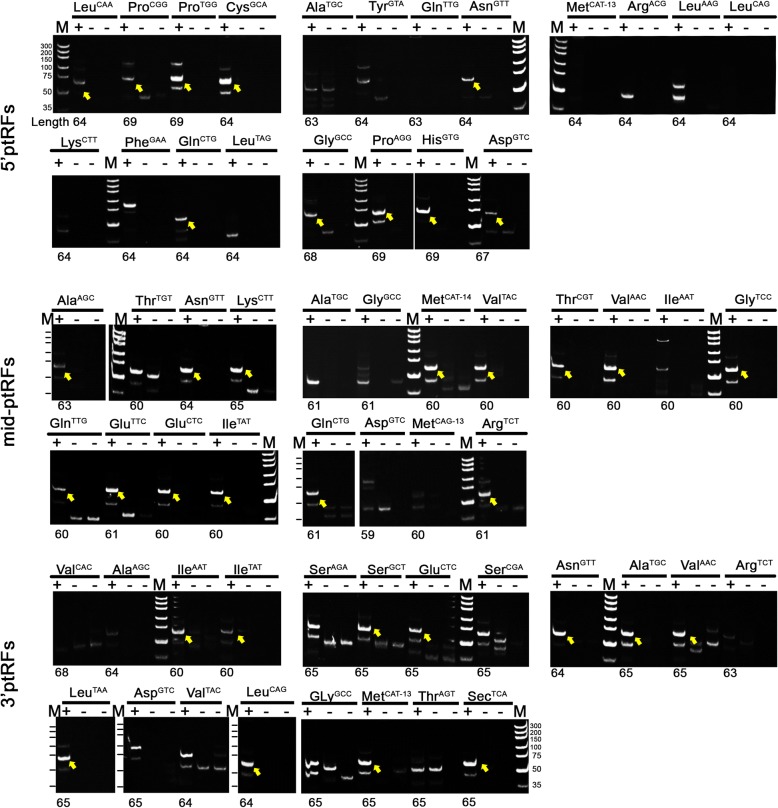
Fig. 3.
Validation of ptRFs by stem-loop RT-PCR. Each ptRF is shown in three adjacent lanes. From left to right represents stem-loop RT-PCR with P. falciparum RNA template (left, “+”), without RNA template (middle, “-”), or without reverse transcriptase (right, “-”), respectively. “M” indicates the DNA ladder. “Length” shows the expected size of PCR products, which is calculated by the size of each ptRF from the deep sequencing data plus 40 bp of nucleotides technically introduced by the design of specific stem-loop primers. The yellow arrow demonstrates the consistence of the PCR product size on the gel with the expected length

