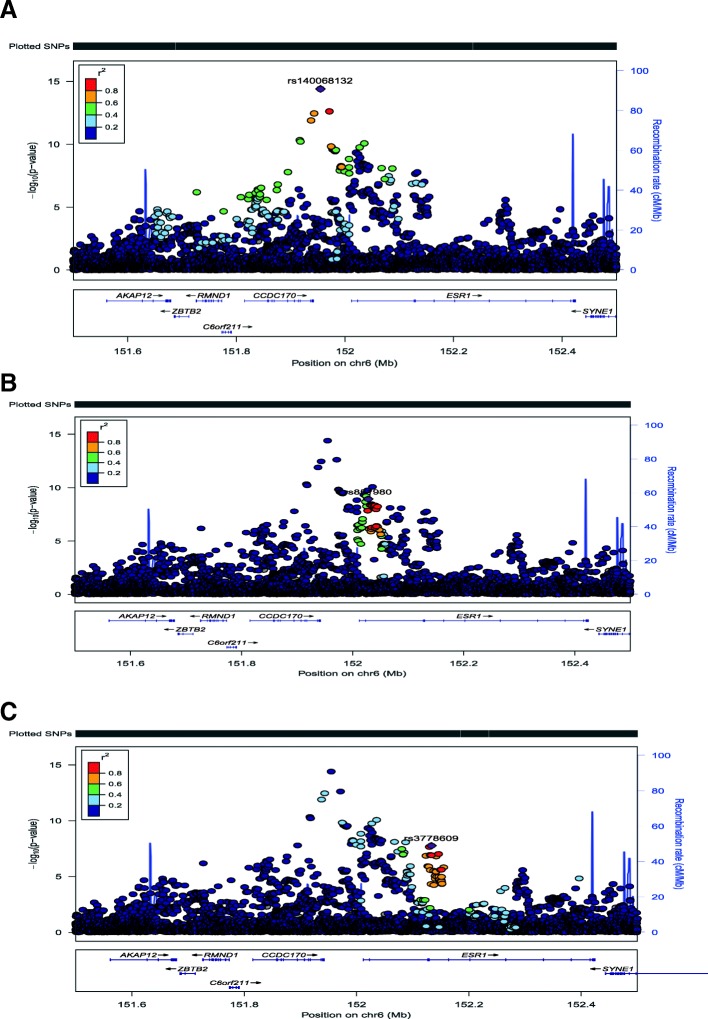
Fig. 1.
Association results with SNPs on chromosome 6 (chr6) from position 151.5 megabases (Mb) to 152.5 MB. On the x-axis are chromosome positions and on the y-axis are the negative log (base 10) p values. Each dot represents the meta-analysis results from the discovery genome-wide association study (GWAS) datasets. The different panels represent coloring by different linkage disequilibrium (LD) values related to an index SNP. Three index SNPs are selected including rs1400685132 (a), rs851980 (b), and rs3778609 (c)

