Figure 1.
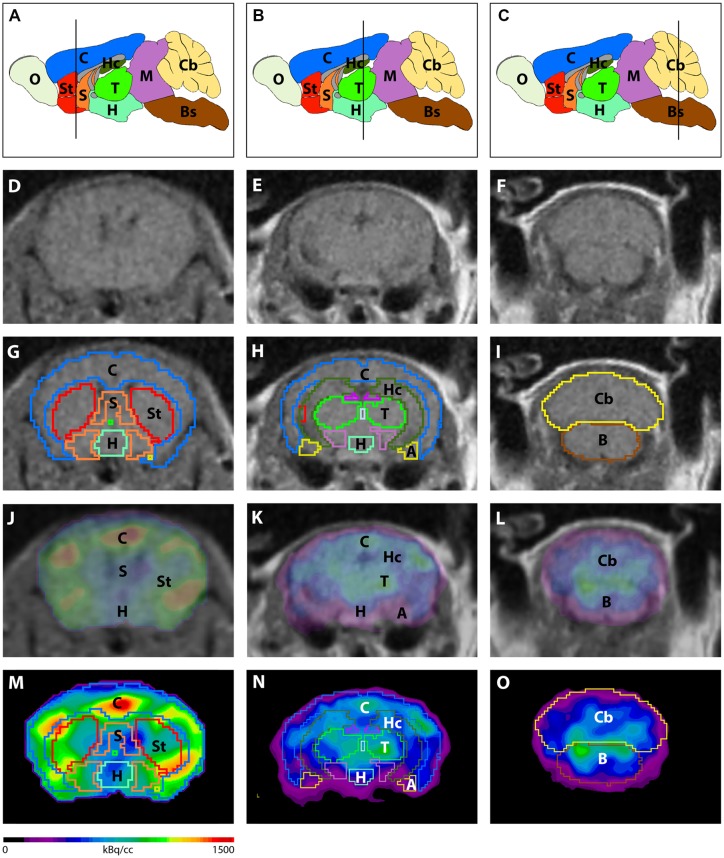
Image analysis using a mouse brain atlas. (A–C) Illustration of brain regions that are ascertained by the mouse brain atlas in sagittal view. Lines indicate the level of coronal slices shown in (D–O). Magnetic resonance imaging (MRI) images (D–F) were used to match volumes of interest (VOIs) of the mouse brain atlas to individual brains of each mouse. (G–I) Examples of predefined VOIs matching the MRI in coronal view. Positron-emission tomography (PET) images were fused to the MRI (J–L) in order to match VOIs to the PET images (M–O). A, Amygdala; Bs, Brain Stem; C, Cortex; Cb, Cerebellum; H, Hypothalamus; Hc, Hippocampus; M, Midbrain; O, Olfactory Bulb; S, Septum/Basal Forebrain; St, Striatum; T, Thalamus.

