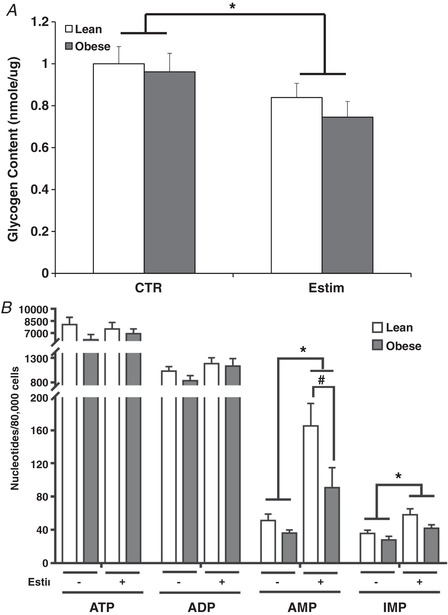
Figure 2. Glycogen and adenine nucleotide content after 24 h of EPS (Estim) in myotubes from lean and severely obese subjects.

A, glycogen content under control (CTR) and immediately after 24 h of EPS. B, adenine nucleotides (ATP, ADP, AMP) and IMP content immediately after 24 h of EPS. Values are means ± SEM. n = 8 per group. * P < 0.05 for difference with EPS versus control condition. # P < 0.05 for difference between lean and obese.
