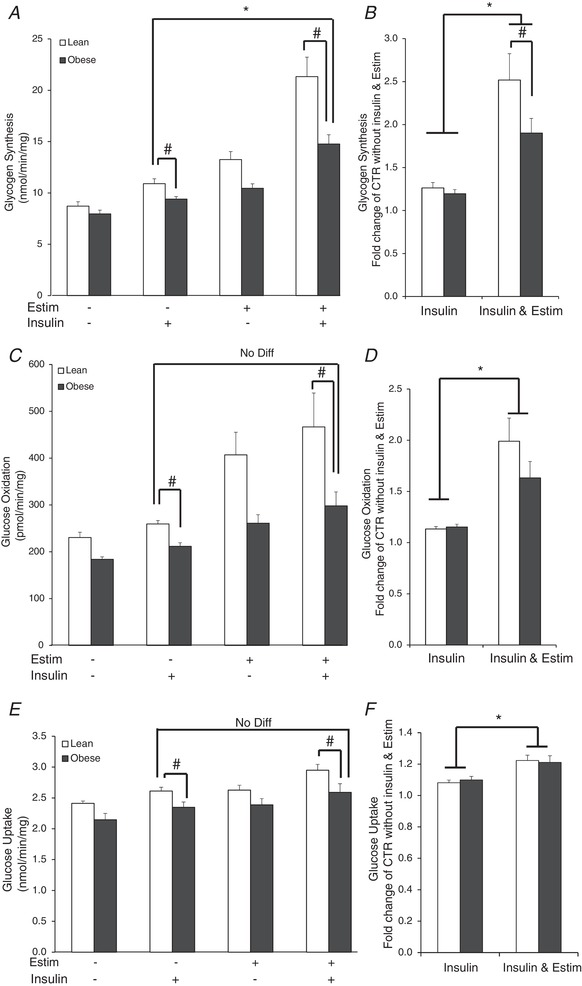
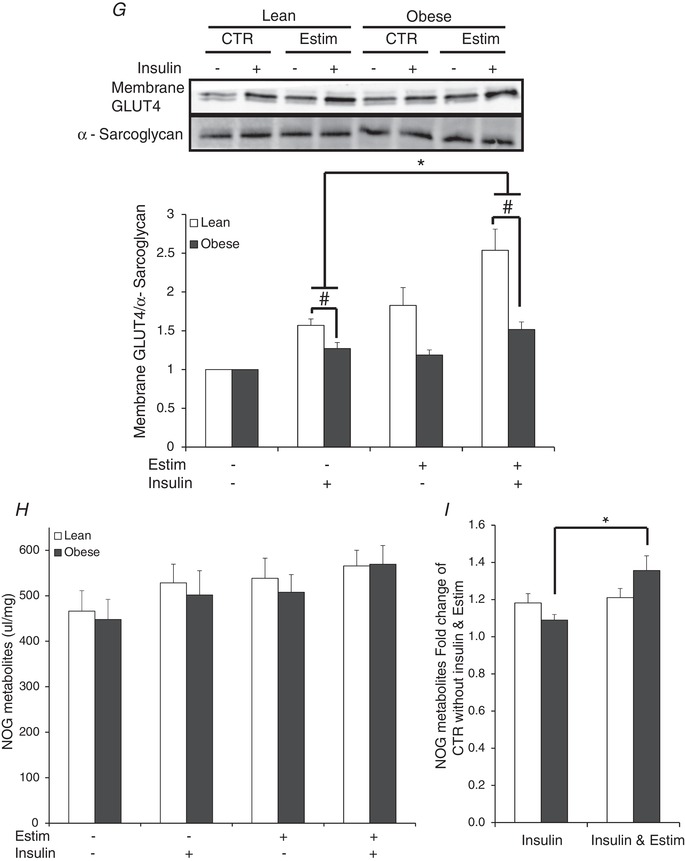
Figure 5. Indices of insulin action in the absence or presence of 100 nM insulin in myotubes from lean and severely obese subjects after 24 h of EPS + 3 h serum starvation (Estim).
A, absolute values of glycogen synthesis. B, fold change in glycogen synthesis over non‐insulin, non‐Estim condition. C, absolute values of glucose oxidation. D, fold change in glucose oxidation over non‐insulin, non‐Estim condition. E, absolute values of glucose uptake. F, fold change in glucose uptake over non‐insulin, non‐Estim condition. G, membrane GLUT4. H, absolute values of non‐oxidized glycolytic products (NOG) in the media. I, fold change in media NOG over non‐insulin, non‐Estim condition. Values are means ± SEM. n = 8 per group. * P < 0.05 for difference with EPS vs. control condition. # P < 0.05 for difference between lean and obese. Data were also compared between the insulin‐stimulated values in the lean subjects versus the insulin‐stimulated + EPS values in the obese subjects to determine if EPS normalized insulin‐stimulated metabolism despite the presence of obesity. In panels A, C and E, there were significant (P < 0.05) main effects for insulin (basal vs. insulin stimulated) and subject group (lean vs. obese).


