Figure 1.
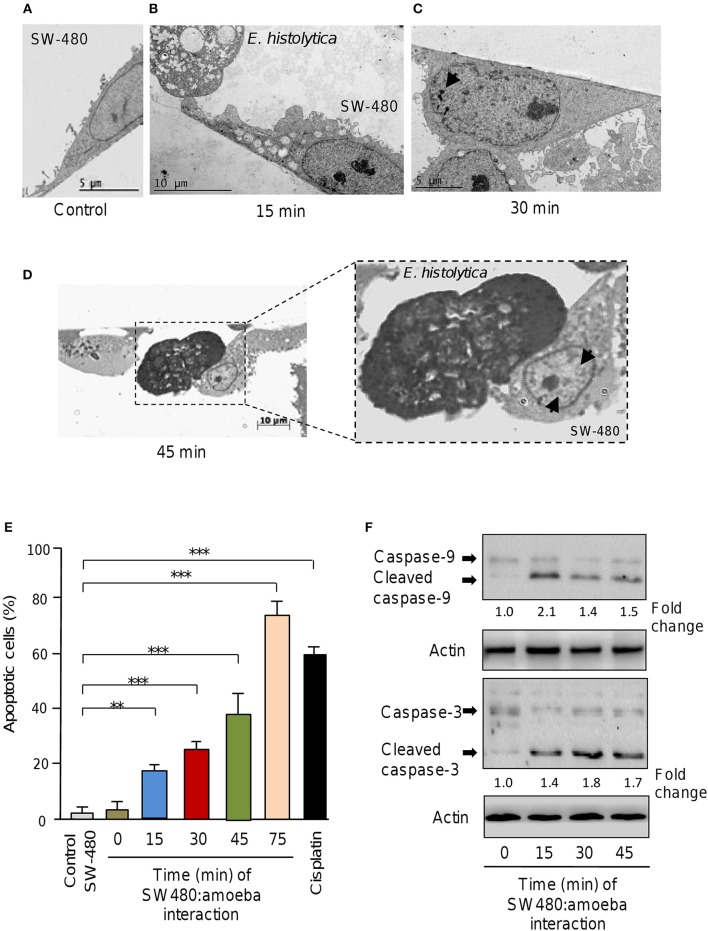
E. histolytica induces apoptosis in SW-480 cells. (A) Representative transmission electron microscopy ultrastructure image of confluent SW-480 cells showing a well-spread cell with irregular microvilli, mitochondria distributed through the cytoplasm and enlarged nuclei. Scale bar 5 μM. (B) Image shows transmission electron microscopy ultrastructure images of trophozoites in contact with colon cells after 15, (C) 30 and (D) 45 min of co-culture. (D) SW-480 cells showing typical early changes associated with apoptosis including a general cell-shrinkage, loss of microvilli and nuclear chromatin condensation denoted by arrows (close up in D). Scale bar 10 μM. (E) Apoptosis assays. SW-480 cells after interaction with E. histolytica trophozoites for 0, 15, 30, 45, and 75 min were analyzed by flow cytometry using annexin V. SW-480 cells without exposure to trophozoites and cells treated with cisplatin (50 μM) for 24 h were used as controls. Data are representative of three independent experiments, performed in triplicate. Bars represent the mean of three independent experiments ± S.D. **p < 0.01. ***p < 0.001. (F) Western blot assays showing cropped images for immunodetection of caspase-9 and−3. Whole protein extracts were obtained from SW-480 cells after interaction with trophozoites for 0, 15, 30, and 45 min and submitted to Western blot assays using caspase-3 and caspase-9 antibodies. Actin antibodies were used as loading control. Immunodetected bands intensity was quantified by densitometry and normalized against actin. Numbers between panels represent the fold change values relative to control (time 0).

