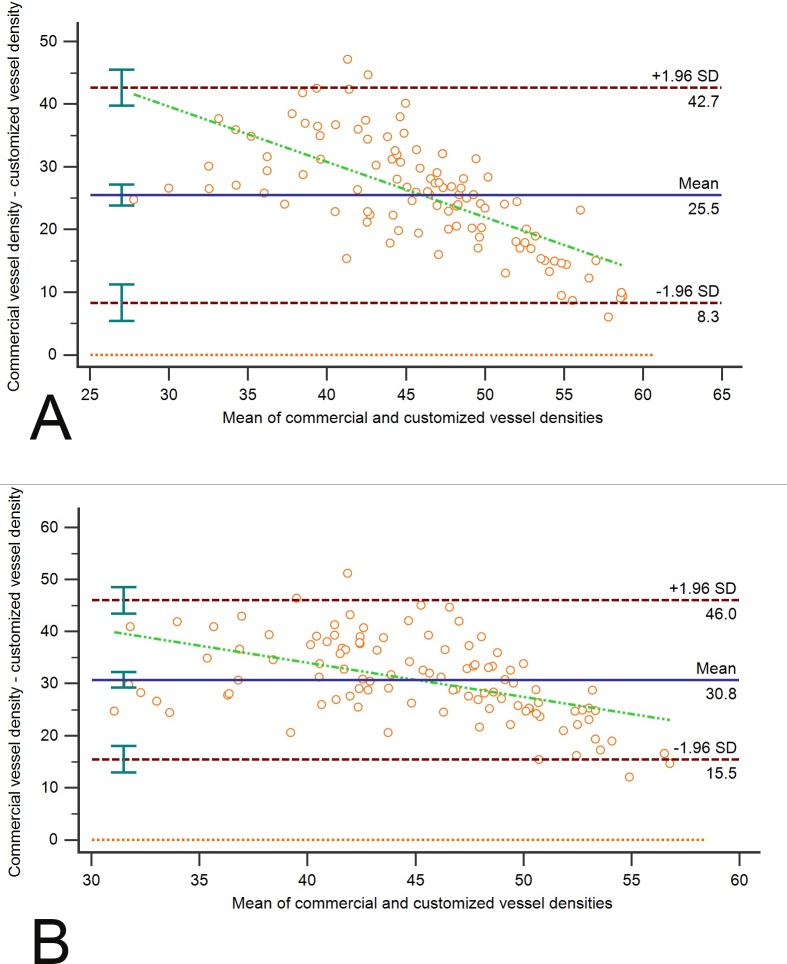
Figure 3.
Bland-Altman plot of commercial and customize peripapillary vessel measurements of trVD (A) and irVD (B) images. Solid horizontal line, simple mean difference (25.51% for trVD image, 30.76% for irVD image); dashed horizontal lines, 95% limits of agreement (8.35% to 42.67% for trVD image and 15.5% to 46.02% for irVD image) with 95% CIs. Green dashed line shows correlation between the mean difference and the magnitude of measurements.

