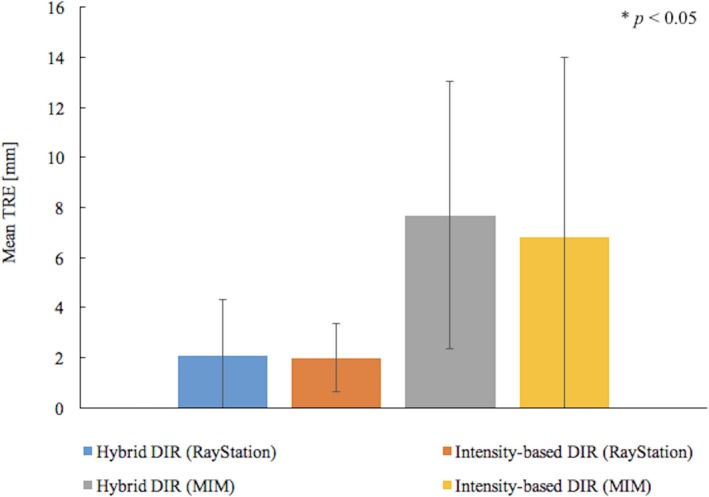
Figure 4.

Comparison of mean TRE for the multiple evaluation points between the hybrid and intensity‐based DIR. Error bars show one standard deviation for the data from ten evaluation pointes for ten patients. When the significant differences were detected between the hybrid and intensity‐based DIR by t‐test, P‐values were indicated in the figure.
