. 2018 Oct 4;10(1):198–207. doi: 10.1039/c8sc03510e

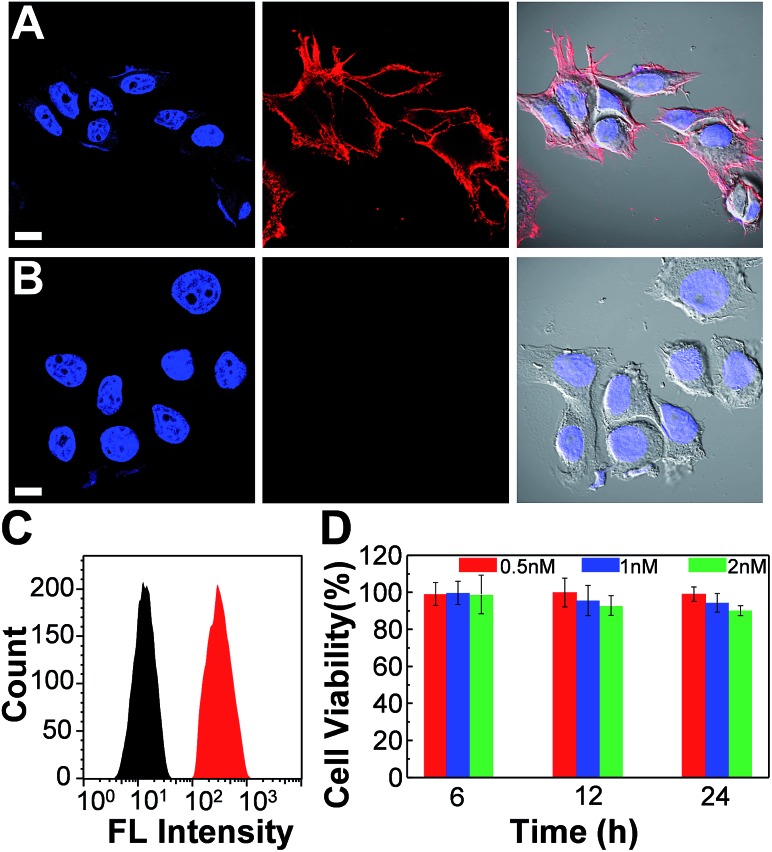
Fig. 8. Confocal fluorescence images of MCF-7 cells labeled with Pdot–streptavidin conjugates and the cytotoxicity along with flow cytometry results. (A) Blue fluorescence (left panel) is from nuclear counterstain Hoechst 34 580 and red fluorescence (middle panel) is from Pdot–streptavidin. The right panel displays the bright-view image overlaid with blue and red fluorescence. (B) Images of negative control samples in which the cells were incubated with Pdot–streptavidin conjugates but in the absence of biotinylated primary antibodies. The scale bars are 30 μm. (C) Flow cytometry measurements of Pdot-labeled MCF-7 cells. The black line shows the fluorescence intensity distribution of the negative control sample in which primary biotin anti-human CD326 EpCAM antibodies were absent. The red line displays the result of Pdot–streptavidin labeled cells in the presence of biotinylated antibodies. (D) The impact of the Pdots on the cell viability after 6, 12, and 24 h of incubation time at different concentrations. The results were determined by using MTT assays.

Fig. 8