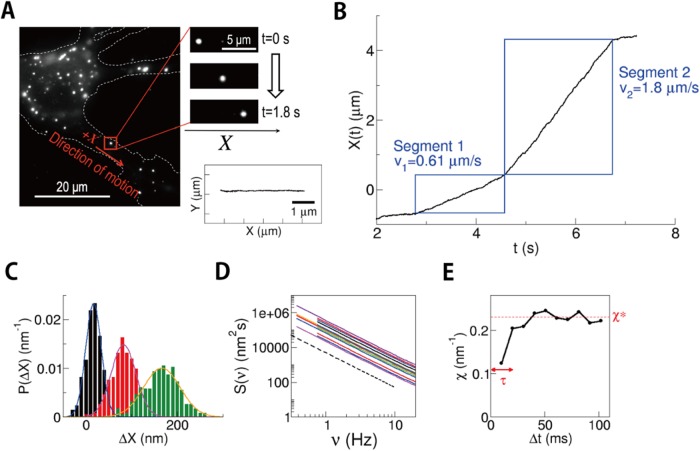
FIGURE 2:
Measurement in the living neuron. (A) Typical view of DiI-stained endosomes in an SCG neuron. In the right bottom panel, a typical two-dimensional trajectory of an endosome during 4 s is shown. (B) Example of the trace of the displacement X(t) of an endosome, which showed a velocity change in the middle of the run event. The direction of movement was set as a plus direction of X. Segments for the analysis (rectangle areas) were determined by fitting the trajectory to the constant velocity movement as detailed under Materials and Methods. (C) Gaussian distribution of displacement ΔX = X(t + Δt)-X(t) in the cases Δt = 10.2 ms (blue), 51.0 ms (pink), and 102 ms (green). (D) Power spectrum of the position X(t) in a constant velocity segment is inversely proportional to the square of the frequency (the dotted line with a slope of –2) (n = 12), which is consistent with the assumption of Gaussian noise. (E) Relaxation of χ. χ* and τ denote the value of convergence and the time constant, respectively. See also Supplemental Figures S1 and S2 for a detailed analysis of χ.

