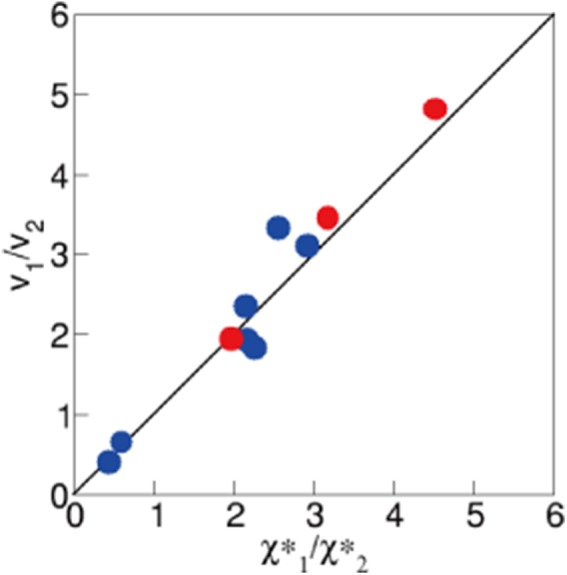
FIGURE 3:

Velocity ratio of axonal endosomes in vivo. Confirmation of the proportional relation between the velocity and the fluctuation (Eq. 9) (n = 3 for anterograde, n = 7 for retrograde from >200 traces). The traces with two successive constant velocity segments with different velocities v1 and v2 (see Figure 2B, for example) were analyzed.
