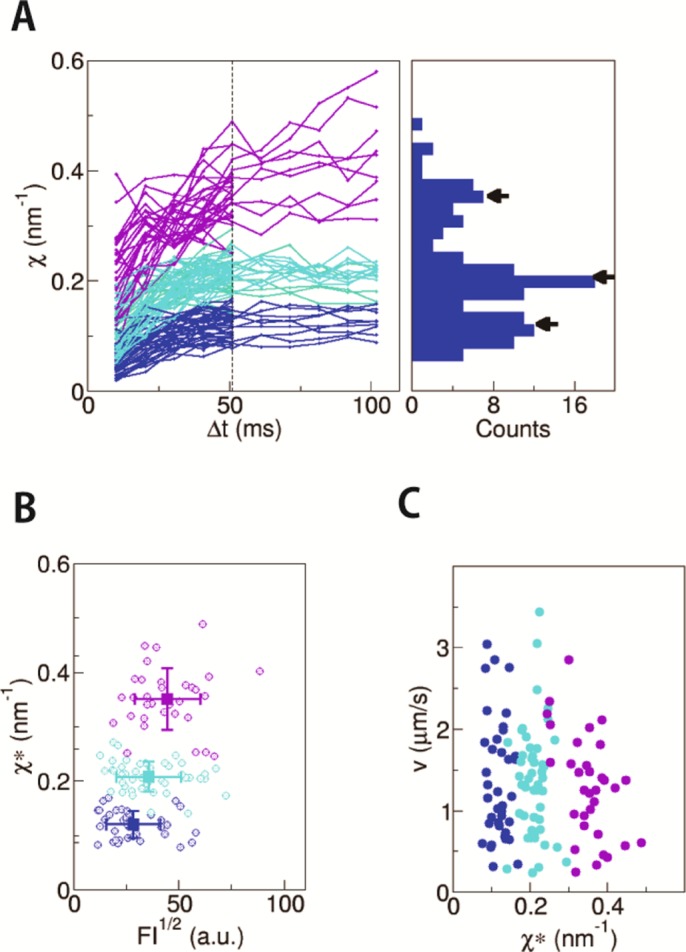
FIGURE 5:

Measurement of χ for retrogradely transported endosomes in axon. (A) The traces of χ plotted against Δt for anterograde endosomes (n = 119). They were classified into three clusters by k-means clustering (indicated with different colors; see Materials and Methods for the details). The distribution of χ* is shown as a histogram. The positions of the cluster centers are indicated by arrows. (B) The fluctuation χ* is plotted against the square root of fluorescence intensity (FI), which is a proxy for the radius of the endosome. The color of each data point is the same as in the left panels in A, which reflects the number of FPUs. The average and the SD for each cluster are shown with square symbols with error bars. There was a weak correlation between χ* and (FI)1/2 (r = 0.33), as observed with anterograde endosomes (Figure 4B). (C) The χ*–velocity relation. The colors for the data points are the same as in the other panels.
