FIGURE 1:
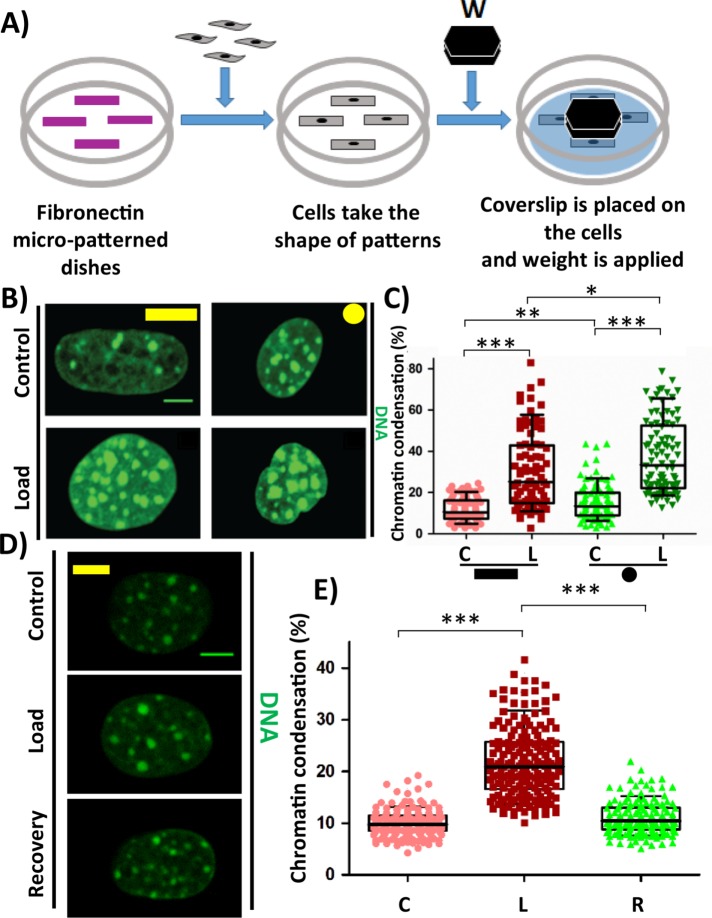
Compressive force causes chromatin condensation. (A) Experimental setup for Compressive force experiment. (B) Maximum intensity projection of confocal images of nucleus. DNA stained with DAPI (green). (C) Chromatin condensation in percentage based on DAPI stain of the nucleus. N: Rectangle (C# = 83, L# = 83); Circle (C# = 93 and L# = 90). (D) Maximum intensity projection of confocal images of nucleus. DNA stained with DAPI (green). (E) Chromatin condensation in percentage based on DAPI stain of the nucleus. C# = 138, L# = 144, R# = 124. Whisker box plotted from 10 to 90 percentile. Student’s t test, ***p < 0.0001, **p < 0.01, *p < 0.05, ns = not significant. Scale bar: 5 µm. #C = control; L = load, and R = load + recovery.

