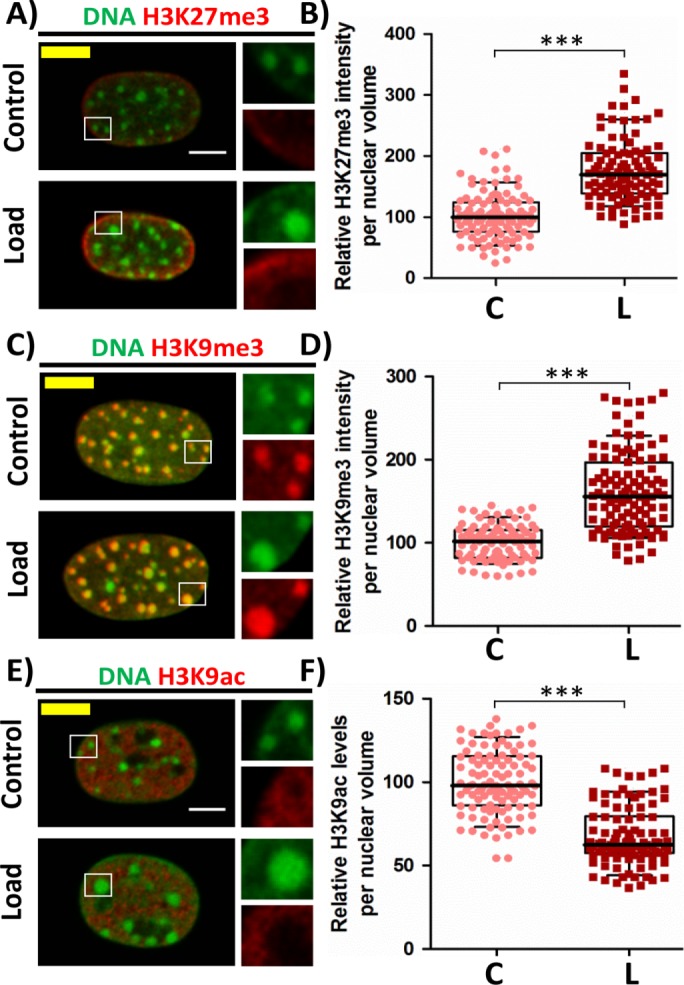
FIGURE 2:

Increased heterochromatin marks and decreased euchromatin mark in response to CF. (A) Single cross-sectional slice of the nucleus. DNA stained with DAPI (green) and IF staining of H3K27me3 (red). (B) Relative H3K27me3 intensity levels per nuclear volume based on IF staining. N: C# = 107, L# = 99. (C) Maximum intensity projection of confocal images of nucleus. DNA stained with DAPI (green) and IF staining of H3K9me3 (red). (D) Relative H3K9me3 intensity levels per nuclear volume based on IF staining. N: C# = 86, L# = 111. (E) Single cross-sectional slice of the nucleus. DNA stained with DAPI (green) and IF staining of H3K9ac (red). (F) Relative H3K9ac intensity levels per nuclear volume based on IF staining. N: C# = 103, L# = 102. Whisker box plotted from 10 to 90 percentile. Student’s t test, ***p < 0.0001. Scale bar: 5 µm. #C = control and L = load.
