FIGURE 3:
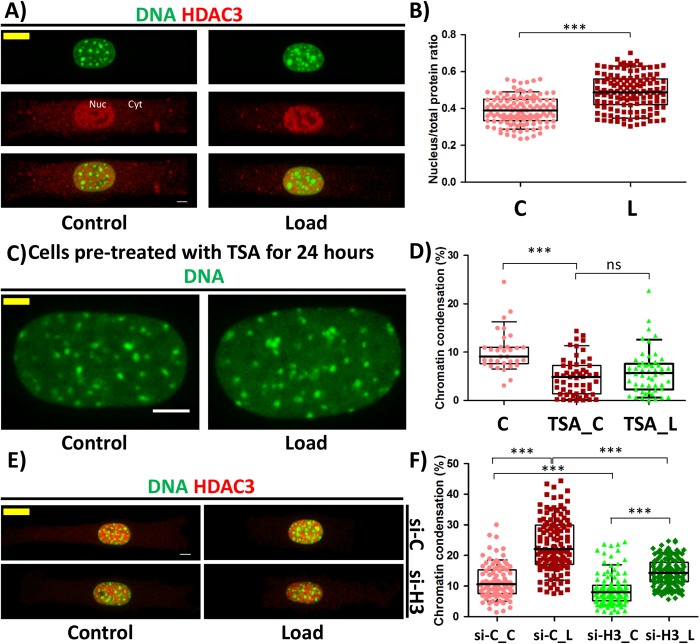
HDAC3 is a critical regulator of compressive force–induced heterochromatin. (A) Maximum intensity projection of confocal images of cell. DNA stained with DAPI (green) and IF staining of HDAC3 (red). Nuc = nucleus fraction and Cyt = cytoplasmic fraction (B) Nuclear to total protein ratio of HDAC3 based on IF staining. N: C# = 124, L# = 132. (C) Maximum intensity projection of confocal images of a nucleus from cells treated with Trichostatin A. DNA stained with DAPI (green). Scale bar: 5 µm. (D) Chromatin condensation in percentage based on DAPI stain of the nucleus. N: C# = 33, TSA_ C# = 55, TSA_ L# = 53. (E) Maximum intensity projection of confocal images of cell. DNA stained with DAPI (green) and IF staining of HDAC3 (red). Si-C = Cells transfected with control siRNA and si-H3 = cells transfected with siHDAC3. (F) Chromatin condensation in percentage based on DAPI stain of the nucleus. N: si-C_C = 96, si-C_L = 125, si-H3_C = 114, si-H3_L = 131. Whisker box plotted from 10 to 90 percentile. Student’s t test, ***p < 0.0001, ns = not significant. Scale bar: 5 µm. #C = control; L = load; TSA_C = TSA-treated control; TSA_L = TSA-treated load; si-C_C = control siRNA-treated rectangle control; si-C_L = control siRNA-treated rectangle load; si-H3_C = HDAC3 siRNA-treated rectangle control; si-H3_L = HDAC3 siRNA-treated rectangle load.

