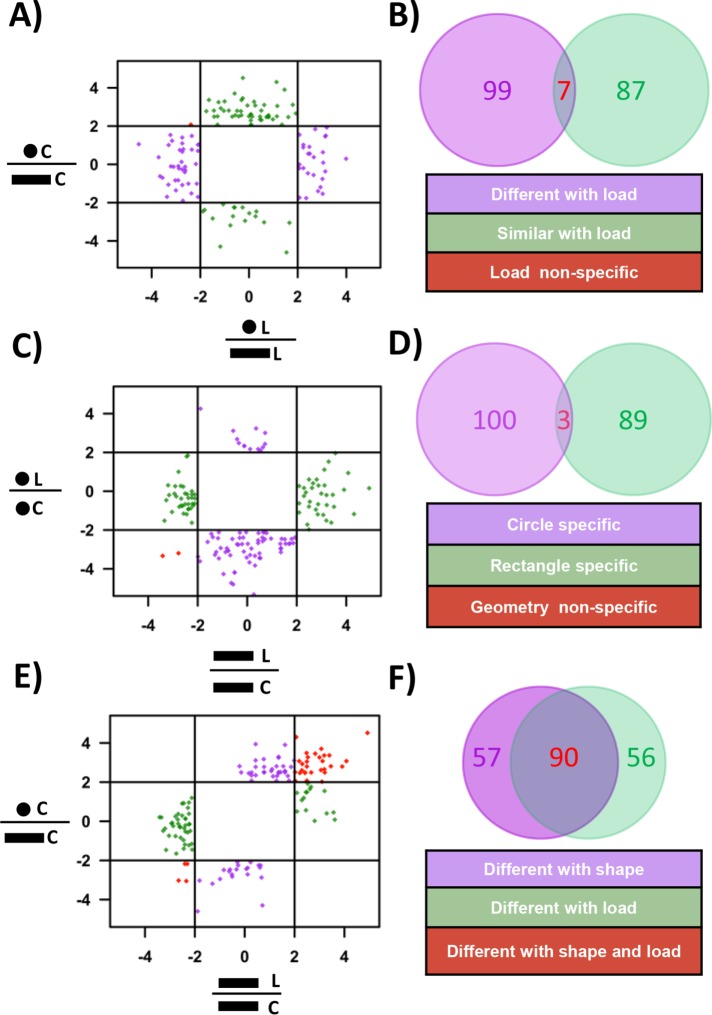
FIGURE 7:
Geometry specific global gene expression changes in response to compressive force. (A) Plot between the expression ratio log2 (fold change) of genes between circular and rectangular cells with and without exposure to compressive force. (B) Venn diagram representing the number of genes that are either similar or different with load. (C) Plot between the expression ratio log2 (fold change) of genes with and without exposure to compressive force in circular and rectangular cells. (D) Venn diagram representing the number of genes whose expression is unique to either of the two geometries. (E) Plot between the gene expression ratio log2 (fold change) of genes before and after applying compressive force on rectangular cells and expression ratio between circular and rectangular cells. (F) Venn diagram representing the number of genes whose expression is unique to compressive force or changing geometries. C = control and L = load.

