FIGURE 2:
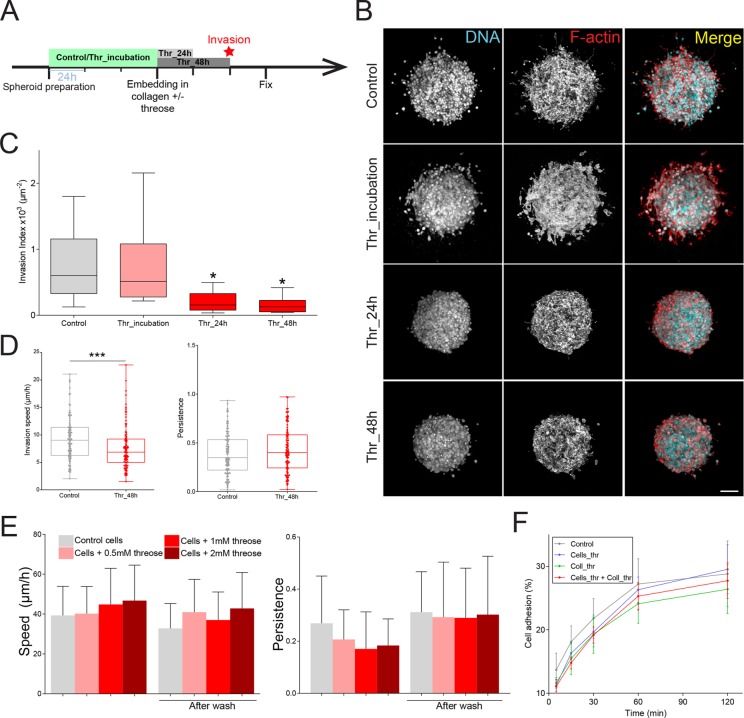
Collagen stiffening before the onset of invasion inhibits cancer cell invasion. (A) Timeline representing the chronology of the experiment. Cancer cell were plated in agarose-coated wells for 3 d to form spheroids in the absence (Control) or presence of threose (Thr_incubation). Spheroids were then embedded in collagen droplets with or without threose. Threose was washed out 24 h (Thr_24 h) and 48 h (Thr_48 h) later. All spheroids were fixed at day 3 postembedding. (B) Maximum intensity projections of cancer cell spheroids at day 3. F-actin (red) and DNA (cyan) were respectively stained with phalloidin-rhodamin and DAPI. Scale bar indicates 100 µm. (C) Quantification of cancer cell invasion. Invasion index is defined as the ratio between the number of invading nuclei of cancer cells and the area of the spheroid contour. Data are expressed as box and whiskers (minimum to maximum) of at least N = 3 separate experiments. The p values are compared with control condition using Newman–Keuls multiple comparison test (*p < 0.05). (D) Quantification of single-cell invasion/migration in three-dimensional collagen gels (left: speed; right: persistence) ± 1 mM of threose, after a 48 h incubation in threose. Persistence was defined as the final cell displacement divided by the length of the trajectory. Results are represented as box and whiskers (minimum to maximum) where each point represents an individual cell. The p value was calculated using Mann–Whitney test for n = 107 cells for control and n = 105 cells for threose over n = 3 separate experiments (***p < 0.001). (E) Quantification of migration (left: speed; right: persistence) of CT26 cancer cells with increasing concentrations of threose treatment plated on glass. Measurements were performed during threose treatment and after wash. Migration persistence was defined as the final cell displacement divided by the length of the trajectory. Results are represented as a histogram with mean + SD for three independent experiments. The p values were calculated using Newman–Keuls multiple comparison test and showed no statistical difference. (F) Quantification of the capacity of control cells to adhere to collagen (control, gray) or to threose-treated collagen (Coll_thr, green) and of threose-treated cells to adhere to control collagen (Cells_thr, blue) or to threose-treated collagen (Cells_thr + coll_thr, red). Measurements were performed at 0, 15 min, 30 min, 1 h, and 2 h. Results are expressed as an XY coordinate with mean ± SD with data representing an average over three independent measurements. The p values are compared with control condition using Dunnett’s multiple comparison test and showed no statistical difference.

