FIGURE 3:
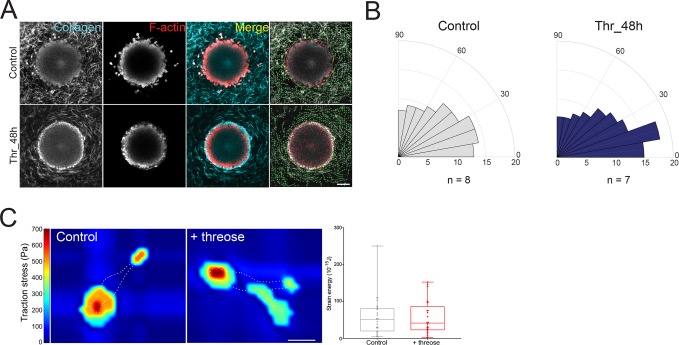
Collagen stiffening before the onset of invasion prevents fiber alignment by cancer cells. (A) Two-dimensional slices of cancer cell spheroids in collagen I at day 3. F-actin (red) was stained with phalloidin-rhodamine and collagen was imaged using reflectance (cyan). Right panel, overlaid images of collagen I matrices containing cancer cell spheroids generated using the software CurveAlign (UW–Madison; http://loci.wisc.edu/software/curvealign). Yellow line indicates the edge of the spheroid, and green lines indicate fibers orientation with respect to the closest point on the spheroid edge. Scale bar = 100 µm. (B) Rose plots representing the frequency of distribution of the absolute angles of collagen fibers within the range of 0°–90° with respect to the closest point on the spheroid edge. Data represent the average of 7 < n < 8 spheroids. Fibers parallel to the tumor edge lie in the 0°–30° angles. (C) Left, representative traction force map of a control and a threose-treated cell on collagen-coated polyacrylamide gels with Young’s modulus of 5 kPa. White dotted line represents the cell’s edge. Color code gives the magnitude of traction stress in Pa, which corresponds to forces of pN/µm2. Scale bar = 20 µm. Right, corresponding mean force (strain energy) exerted by CT26 cancer cells. Results are represented as box and whiskers (minimum to maximum), where each point represents an individual cell. The p value was calculated using Mann–Whitney test for n = 27 cells for control and n = 25 cells for threose over three separate experiments and showed no statistical difference.

