FIGURE 4:
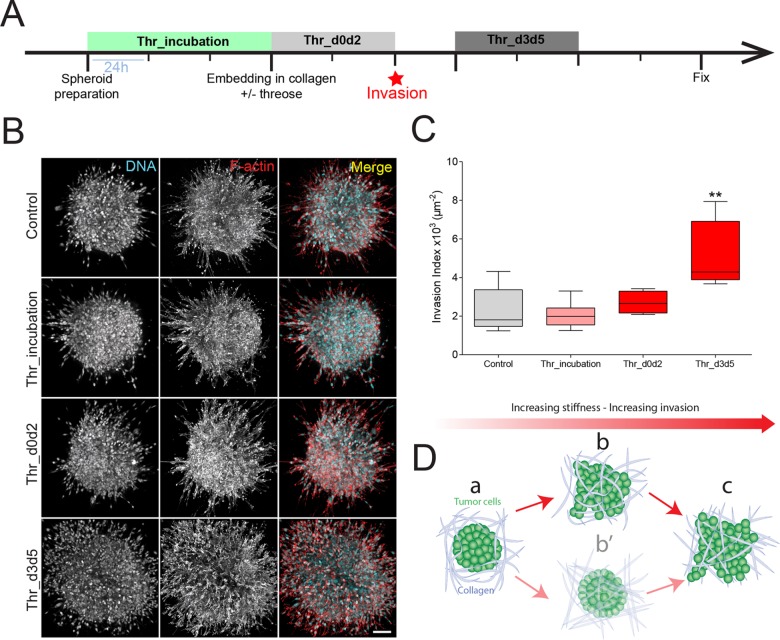
Collagen stiffening after the onset of invasion favors cancer cell invasion. (A) Timeline representing the chronology of the experiment. Cancer cell spheroids were left to form in agarose-coated wells for 3 d with (Thr_incubation) or without (Control) threose. Spheroids were then embedded in collagen droplets with (Thr_d0d2) or without (Control) threose for 48 h. Three days postembedding, threose was added in the media for 48 h (Thr_d3d5). All spheroids were fixed at day 7 postembedding. (B) Maximum intensity projections of cancer cell spheroids at day 7. F-actin (red) and DNA (cyan) were respectively stained with phalloidin-rhodamin and DAPI. Scale bar indicates 100 µm. (C) Quantification of cancer cell invasion. Invasion index is defined as the ratio between the number of invading nuclei of cancer cells and the area of the spheroid contour. Quantification results are expressed as box and whiskers (minimum to maximum) of N = 3 separate experiments. The p values are compared with control condition using Newman–Keuls multiple comparison test (**p < 0.01). (D) Model, tumor cells are surrounded by the ECM (a). Cancer cells start invading the ECM before the matrix gets remodeled (b) rather than the matrix being remodeled beforehand (b′). As cancer cells invade the matrix, collagen fibers get aligned (c), which sets up positive feedback to enhance invasion.

