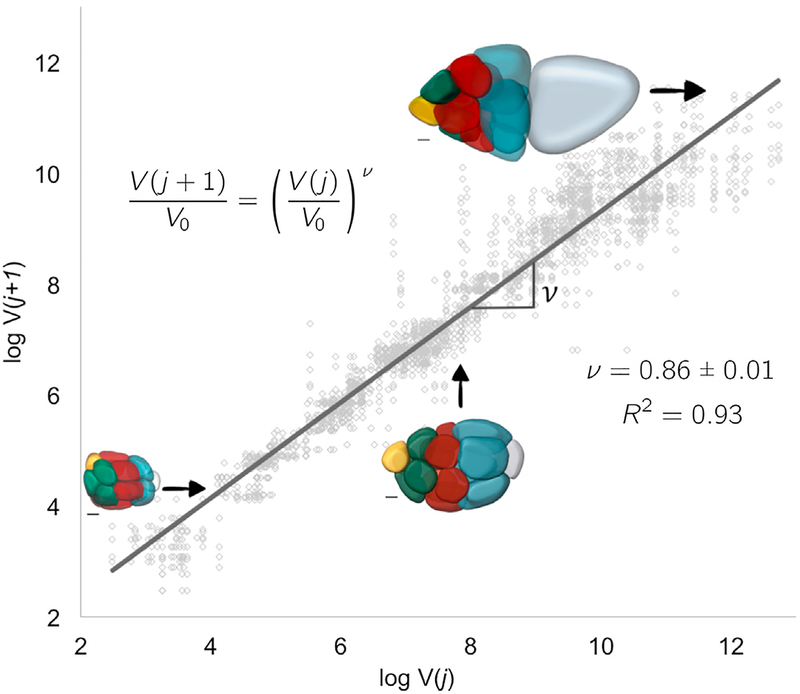
Figure 4. Allometric Scaling in Collective Cell Growth.
A plot of log V(j + 1) versus log V(j) where j = 1,…, 5. To extract ν, we fit log to data pairs of nuclear volumes of nurse cells from consecutive layers j and j + 1; each egg chamber has 52 such pairs. The extracted value of ν = 0.86 ± 0.01, is consistent with biased transport toward the posterior oocyte (data from 41 egg chambers). The insets show representative color-coded membrane-based reconstruction of a young, roughly spherical egg chamber (bottom left), an egg chamber beginning to elongate (middle), and an older ellipsoidal egg chamber (top right). Scale bars, 10 μm.

