Figure 6.
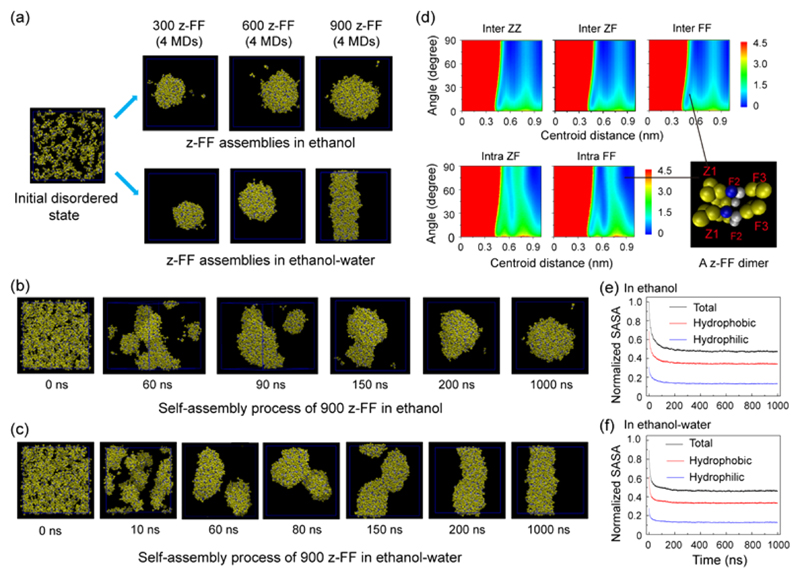
Multiple microsecond CG-MD simulations of the self-assembly of 300, 600, and 900 z-FF molecules in ethanol and an ethanol−water mixture. All simulations were initiated from disordered states. (a) The z-FF assemblies generated at t = 1 μs of CG-MD simulations in ethanol (upper panel) and in an ethanol−water mixture (lower panel). (b,c) Representative CG-MD self-assembly process of 900 z-FF molecules leading to (b) the formation of spheres in ethanol and (c) the formation of fibrils in an ethanol−water mixture. (d) The free energy surface of z-FF assemblies as a function of the centroid distance and the angle between two aromatic rings of inter/intra-molecular ZZ, ZF, and FF pairs. A parallel z-FF dimer from the z-FF spheres/fibrils in the bottom right shows the parallel/T-shaped stacking pattern between two inter/intra-molecular FF aromatic rings. (e,f) Normalized solvent accessible surface area (SASA) of z-FF assemblies in (e) ethanol and (f) an ethanol−water mixture as a function of simulation time. The SASAs include total, hydrophobic, and hydrophilic SASA.

