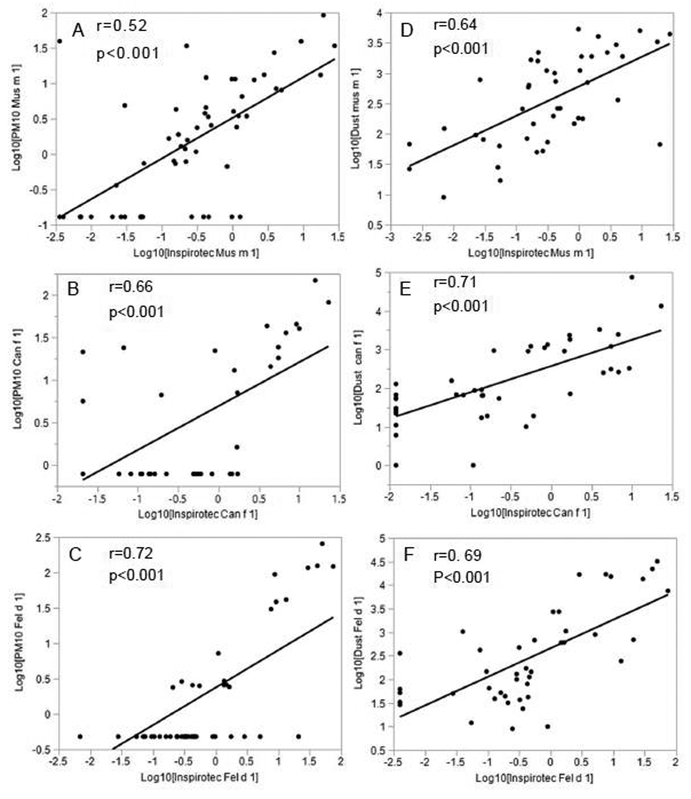
Fig 1. Bivariate analysis of Inspirotec airborne allergen capture compared with two reference methods.
Reference methods were collection by air sampling and dust sampling. Samples were from twenty-five urban, low income Baltimore homes at baseline, 17 at 3 months, and 12 at 6 months. Whether a home is in the active intervention group or the control group is still blinded. Air sampling by PM10 (particles > 10 μm selectively removed with an impinger) and dust collection were as described elsewhere (5). In parallel, Inspirotec samplers were plugged into wall sockets and run for the same period of 5– 7 days. Inspirotec samplers had pre-calibrated flow rates of 100±20 liters/min and were stable within ±10% over multiple usages. PM10 samplers were adjusted to 4 liters/min. Samples from Inspirotec electrodes and PM10 filters were extracted in 1 mL and assayed by Indoor Biotechnologies MARIA™ assays for the 12 common household allergens: Der p 1, Der f 1, mite group 2, Fel d 1, Can f 1, Mus m 1, Rat n1, Bla g 1, Alt a 1, Bet v 1, Asp f 1, Phl p 5. Dust samples were weighed, extracted by standard methods and assay by Indoor Biotech ELISA for Der f 1, Fel d 1, Can f 1, Mus m 1 and Bla g 2. Air sample results were expressed as pg/m3 and dust as μg/g. JMP® Pro 13.0.0 (SAS Institute Inc.Cary, NC) and StataSE 13.0 (StataCorp LLC, College Station, Texas) statistics packages were used. Allergen variables were log10-transformed and r values shown are Pearson’s rho (r) from StataSE. Because there was repeated sampling within the same home, r and p-values were generated using Generalized Estimating equations, which account for the within-home correlation. The best straight line fit to the log10 of the values are shown. Values below the LLOD were assigned a value of LLOD/2.

