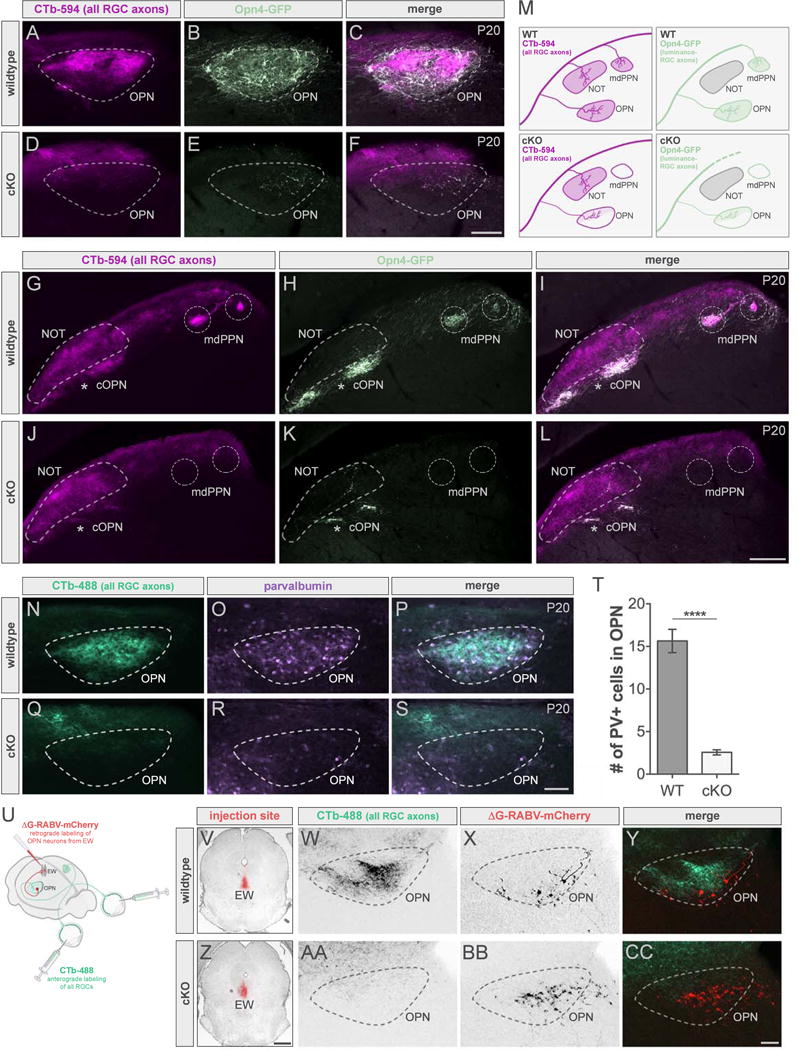
Figure 6. Poly-synaptic effects following ablation of most luminance-sensing RGCs.

(A–L) All RGC (CTb-594, magenta) and luminance-sensing RGC (all ipRGCs, Opn4-GFP, light green) axons in wildtype (WT; top panels) and cKO (bottom panels) mice. Scale bars, 100μm (A–F); 200μm (G–L). (M) Summary schematic. See also Figure S6. (N–S) All RGC axons (CTb-488, green) and PV-expressing cells (purple) in WT (top panels) and cKO (bottom panels). Scale bar, 100μm. (T) Number of PV+ cells in OPN of WTs (dark gray) and cKOs (light gray). Data are represented as mean ± SEM (n = 12-14 mice per group); ****p < 0.0001, Student’s t-test. See also Figure S7. (U) Injection schematic. (V-CC) ΔG-RABV injection site in WT (V) and cKO (Z) mice and corresponding sections of OPN showing all RGC axons (CTb-488, green) and cells retrogradely labeled from EW (red) in WT (W–Y) and cKO (AA–CC). cOPN, caudal OPN; EW, Edinger-Westphal nucleus; mdPPN, medial division of the posterior pretectal nucleus; NOT, nucleus of the optic tract; OPN, olivary pretectal nucleus. Scale bars, 100μm (W–Y and AA–CC); 800μm (V and Z).
