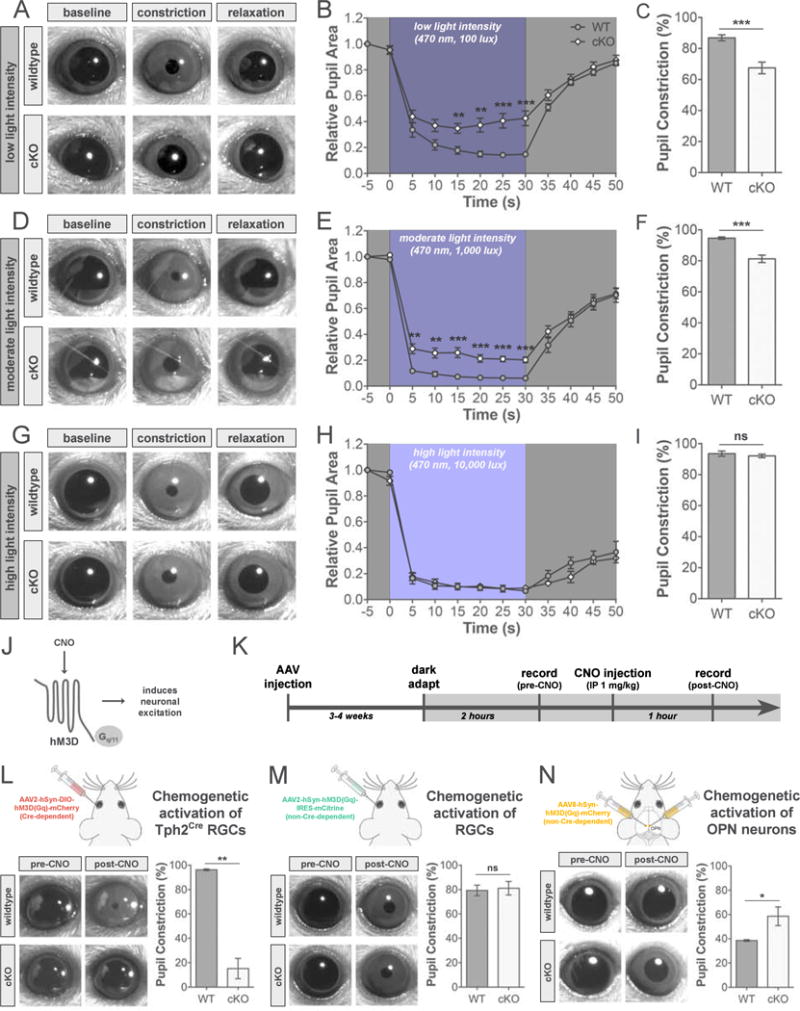
Figure 7. The effect of luminance-sensing RGC ablation on light- and chemogenetic-induced PLR.

(A–I) PLR in response to a single blue LED at 100 (A–C), 1,000 (D–F), and 10,000 lux (G–I). (A, D, G) Examples of pupil size following dark adaptation, peak pupil constriction during light stimulation, and relaxed pupil size following light stimulation in wildtype (WT; top panels) and cKO (bottom panels) mice. (B, E, H) PLR time course in WT (dark gray) and cKO (light gray) mice plotted as pupil area relative to baseline pupil size. (C, F, I) Quantification of % of peak pupil constriction in WT (dark gray) and cKO (light gray) mice. Data are represented as mean ± SEM (n = 9–10 mice per group for B–C, E–F; 3–4 mice per group for H-I); **p < 0.005, ***p <0.001, Student’s t-test. (J) Diagram of Gq-coupled hM3D receptor. (K) Experimental timeline. (L–N) PLR analysis in response to chemogenetic activation of RGCs (L and M) or OPN neurons (N). Schematics of intravitreal or stereotaxic injections of hM3D viruses (top panels). Examples of pupil size before (pre-) and after (post-) CNO injection in WT and cKO mice (bottom left panels). Quantification of % of peak pupil constriction in WT (dark gray) and cKO (light gray) mice after injection of CNO (bottom right panels). Data are represented as mean ± SEM (n = 3–6 mice per group); *p < 0.05, **p < 0.01, Student’s t-test. AAV, adeno-associated virus; CNO, clozapine-N-oxide; hM3D, human M3 muscarinic designer receptor; hSyn, human synaptophysin.
